So many traders quote market axioms and some actually put their hard earned money on the line based upon them.
The most popular (arguable) technical indicator is the moving average. Everyone knows what it is and almost everyone still tracks one or two of them.
It is generally believed that a stock trading above its moving average is bullish and stock trading below its moving average is bearish.
The question I pose is… Have you ever tested to see if that truly is the case? In this post I will examine 4 popular moving averages and their impact on returns across 30+ ETFs and popular individual stocks since January 2006. In this case, pictures say more than any more text can.
Take a look…
ETF’s (8 SMA, 20 SMA, 50 SMA, 200 SMA)
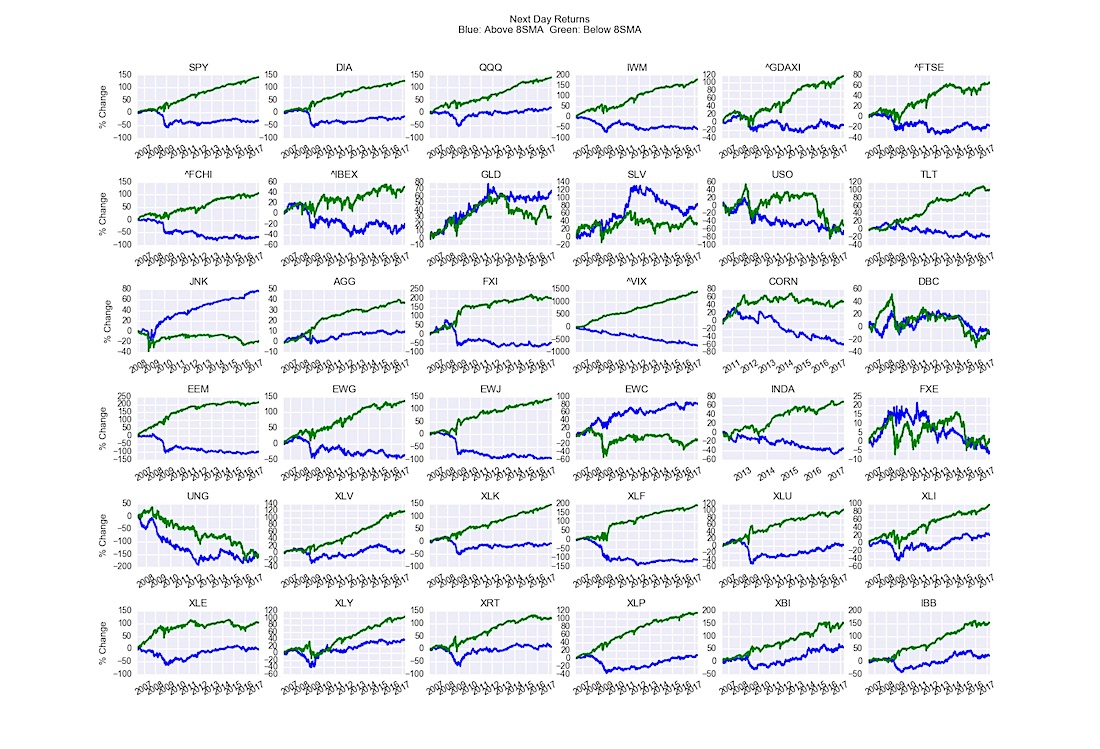
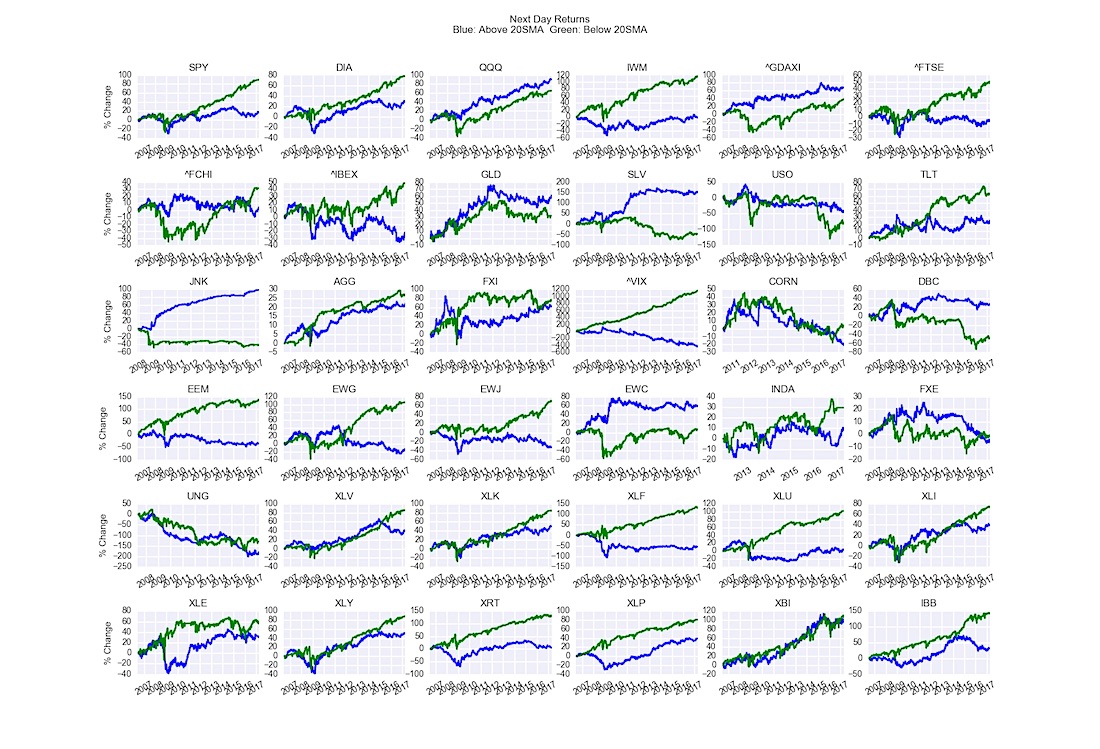
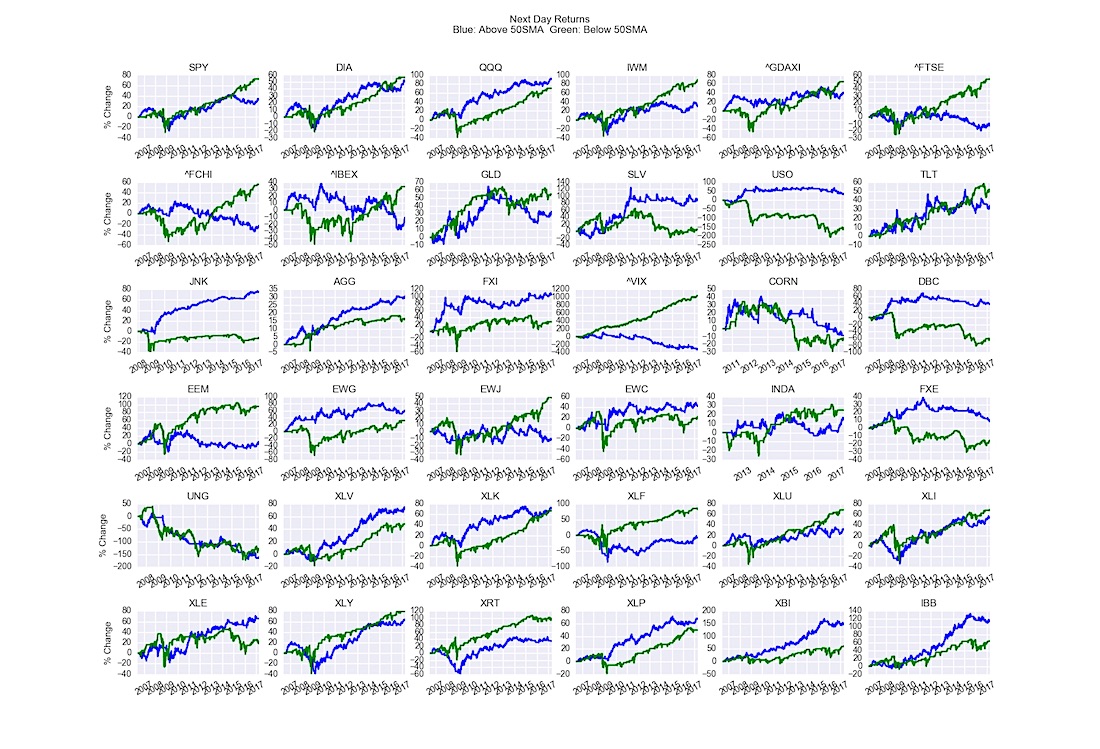
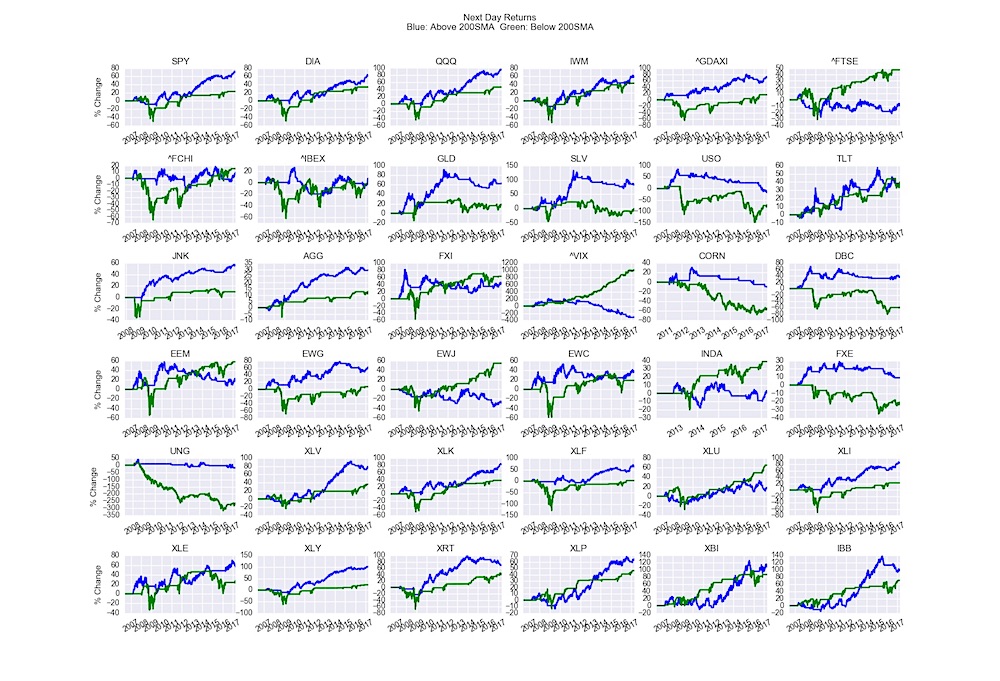
Stocks (8 SMA, 20 SMA, 50 SMA, 200 SMA)
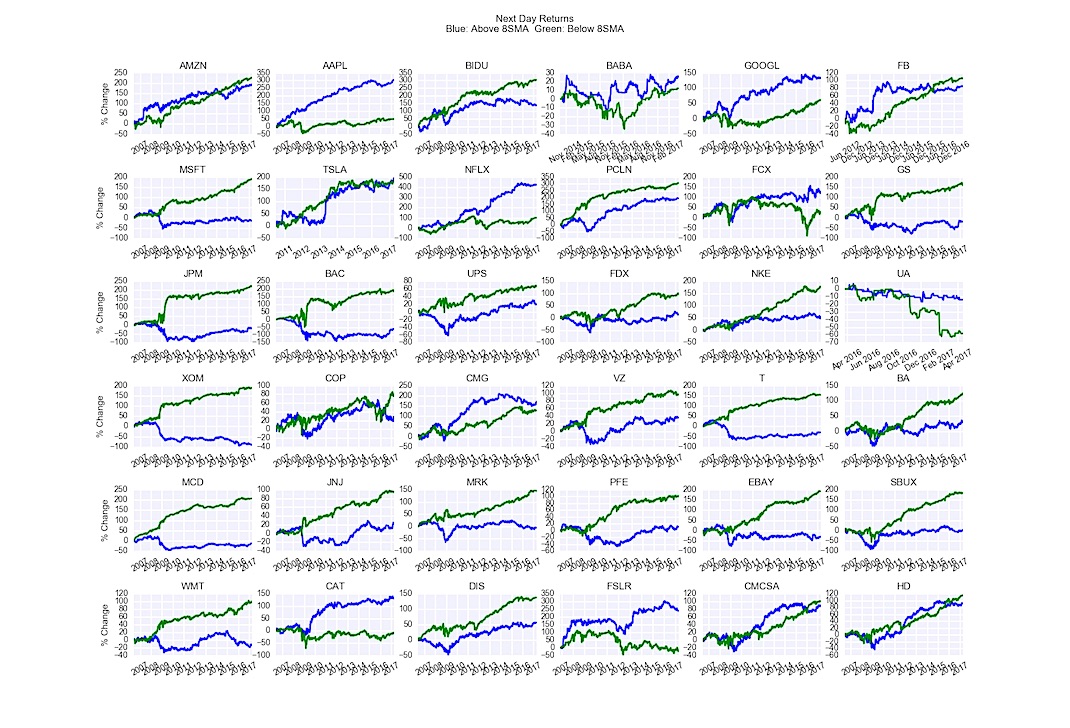
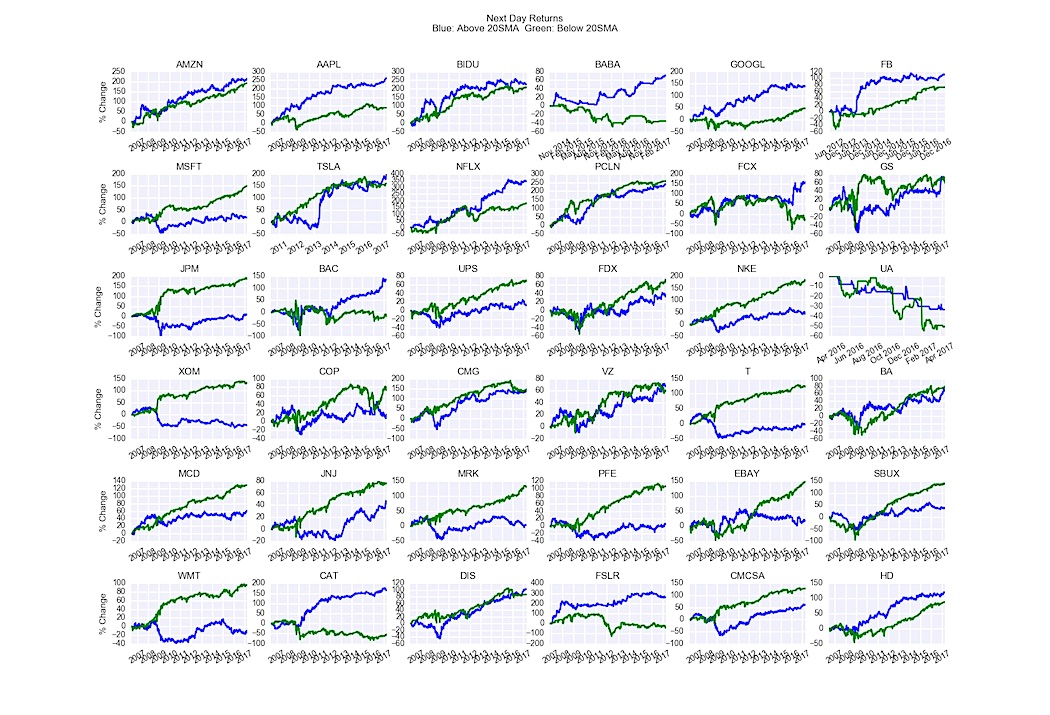
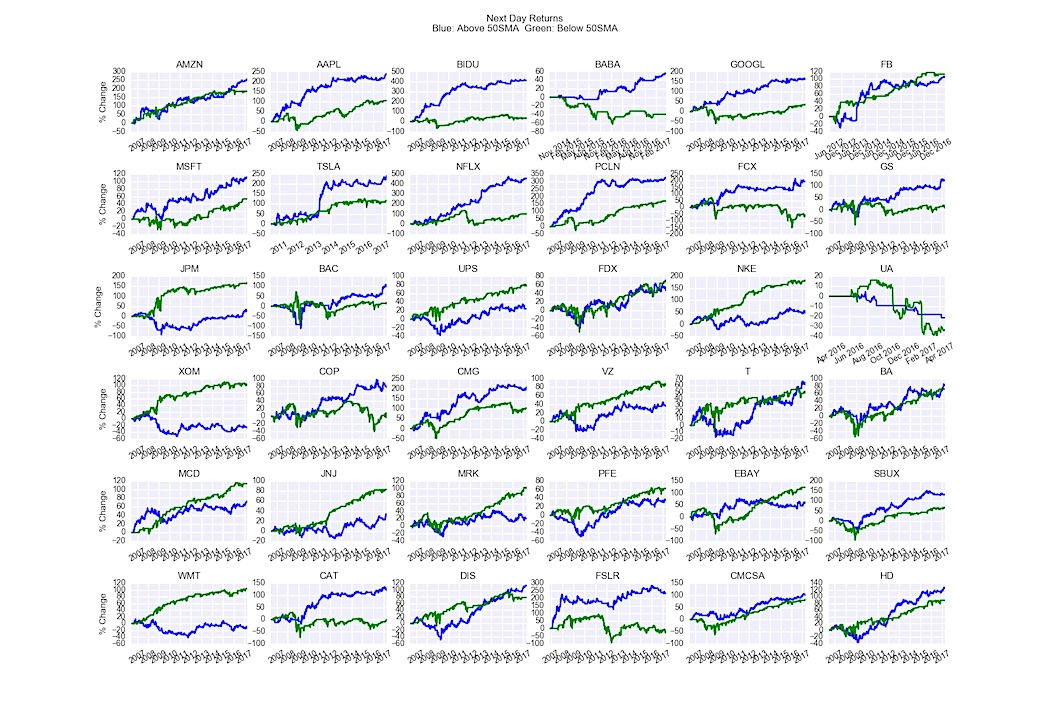
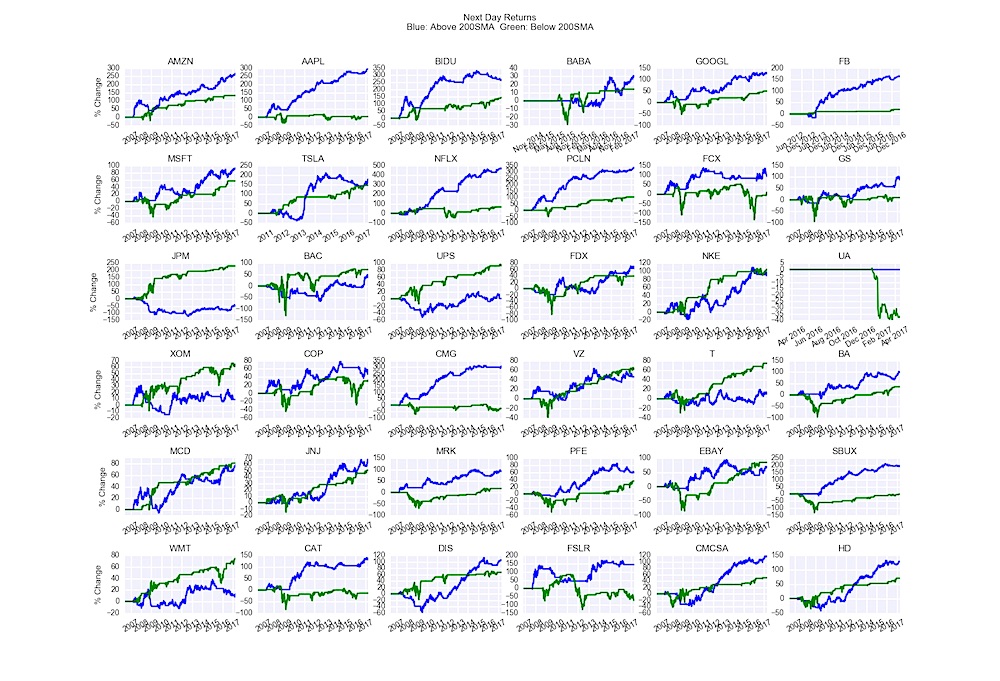
The main takeaway is that each stock and ETF has its own players and personalities. Each security responds differently to technical environments. It is crucial to understand if you should be buying dips or waiting for confirmation. I always recommend testing everything – and if you cannot then Build Alpha can! Even this simple quantitative analysis can add basis points to your bottom line!
Twitter: @DBurgh
No position in any of the mentioned securities at the time of publication. Any opinions expressed herein are solely those of the author, and do not in any way represent the views or opinions of any other person or entity.

: Showing Some Signs of Emerging Strength")
