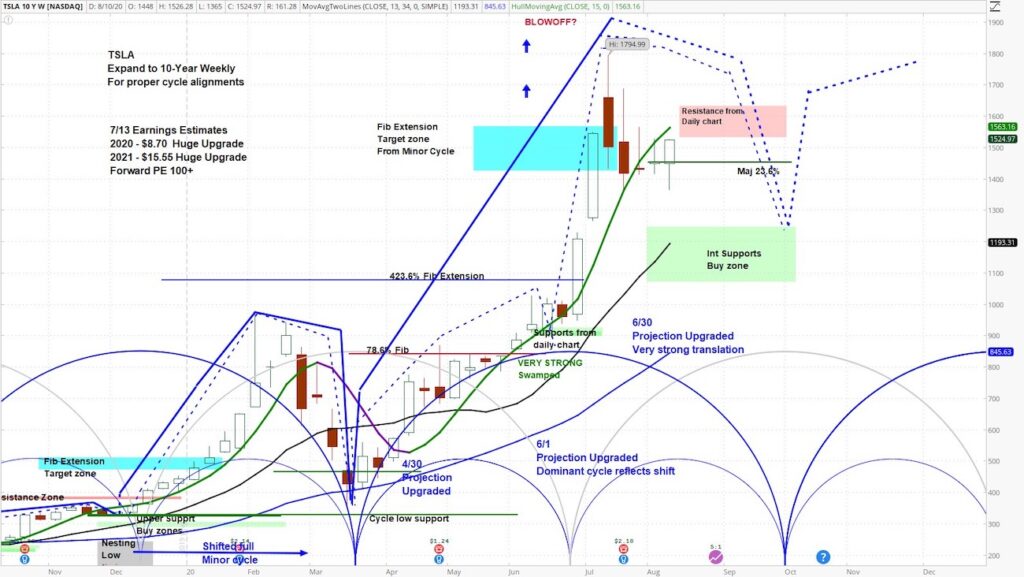
Tesla (TSLA) Weekly Chart
On Tuesday afternoon, Tesla (TSLA) announced a 5:1 stock split.
While this adds no incremental value to the stock, TSLA rallied 11.6% in Wednesday’s session.
Will this catapult Tesla’s stock price to new highs? Or will this rally stall out?
Let’s review our weekly cycle analysis.
At askSlim we use technical analysis to evaluate price charts of stocks, futures, and ETF’s. We use a combination of cycle, trend and momentum chart studies, on multiple timeframes, to present a “sum of the evidence” directional outlook in time and price.
askSlim Technical Briefing:
The weekly cycle analysis suggests that Tesla’s stock TSLA is in the late stages of a rising phase.
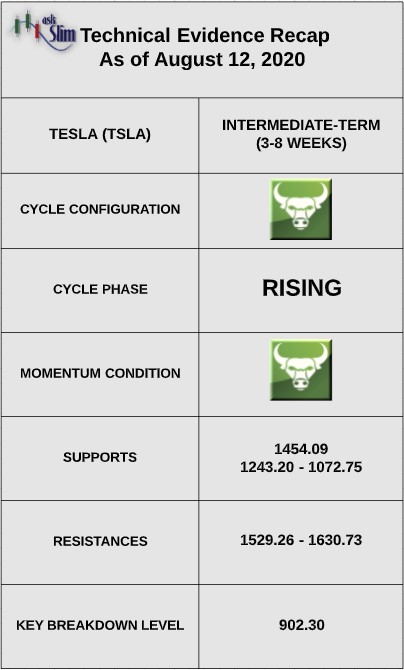
The next projected low is due between the end of September and early October. Weekly momentum remains positive, though.
On the upside, there are short-term resistances from 1529.26 – 1630.73.
On the downside, there is an intermediate-term support at 1454.09 followed by a zone of support from 1243.20 – 1072.75.
askSlim Sum of the Evidence:
TSLA is in a rising phase is now testing a resistance zone beginning at 1530. We see a likelihood that the stock stalls in this area and rotates down to intermediate-term support zone beginning at 1243 by October.
Interested in askSlim?
Get professional grade technical analysis, trader education and trade planning tools at askSlim.com. Write to matt@askslim.com and mention See It Market in your email for special askSlim membership trial offers!
Twitter: @askslim
Any opinions expressed herein are solely those of the author, and do not in any way represent the views or opinions of any other person or entity.

: Showing Some Signs of Emerging Strength")


: Showing Some Signs of Emerging Strength")
