Here are a few markets and assets that I’m watching from a technical perspective. Although the market is aligning for a potential low (or may confirm one) soon, a lot can happen in a couple days. And the S&P 500 is feeling the reverberations of the recent VIX jump.
I’ve also included some additional technical analysis and thoughts on the stock market, treasury yields, and gold as we head into the weekend. There is a lot happening, so it pays to put the technical pieces together.
S&P Futures: (2-3 days)- Bearish- Insufficient proof of any low at hand today (Thursday) and into expiration, there’s a good likelihood of a retest of lows and minor new lows being made that lasts into early next week. As mentioned, stabilization is a definite work in progress. Watch TNX, USDJPY- For Sept S&P, look to buy at/near 2032-5 and SPX cash down at 2040-5.
EuroSTOXX 50 – Similar to SPX, another 2-3 days of weakness also looks possible for EuroSTOXX, which should retest February lows before any bottom is in place. Demark signals will trigger buys based on TD Sequential early next week similar to SPX potentially getting TD Buy Setups.
TECHNICAL ANALYSIS & THOUGHTS
1) Equities might bottom coinciding with a similar move in Treasury yields – Still very important to keep an eye on Treasury yields, Crude, and USDJPY, as equities seem to be tracking all of these quite closely in the short run. Thursday’s break of Tuesday’s lows led to a quick selloff under Tuesday’s lows, but when yields made a sharp rally off the lows, Equities followed suit. While any larger bottom in 10year yields might need to be preceded by some type of bottoming in German Bund yields, it’s important to note that 2yr, 5-year and 10-year yields all closed positive on Thursday, forming Technical “Hammer” type formations after showing Demark signs of exhaustion on intra-day charts.
2) VIX Futures contango an early sign – VIX remains stretched – VIX backwardation and a contango in the curve was present until Thursday’s reversal caused a sharp pullback in Spot VIX, but we’ve still seen VIX get very stretched, outside its Bollinger Bands, and pulled back over 15% from intra-day highs alone on Thursday. While a move back to test these highs in implied vol is likely into early next week, we’ve gotten fairly stretched, while prices remain very much intact, well above May lows.
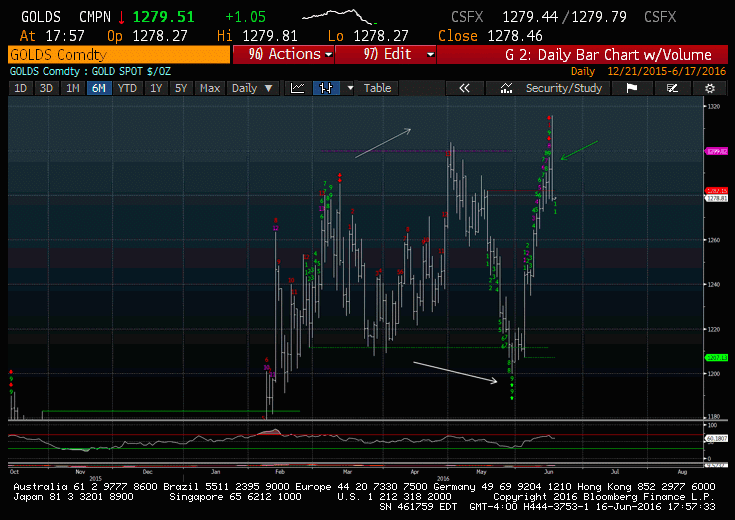
3) Commodities Selloff continues in the short run – Grains, Energy have both pulled back in recent days on a firming in the US Dollar, while the Metals pulled back sharply from earlier highs in Thursday’s trading. Gold’s $35 reversal from early highs looks important as a one-day reversal, and could very well decline in the days ahead after its recent sharp advance, particularly if the US Dollar index exceeds May highs near 96.
Read more from Mark: Treasury Yields Bottom May Hold Key For Equities
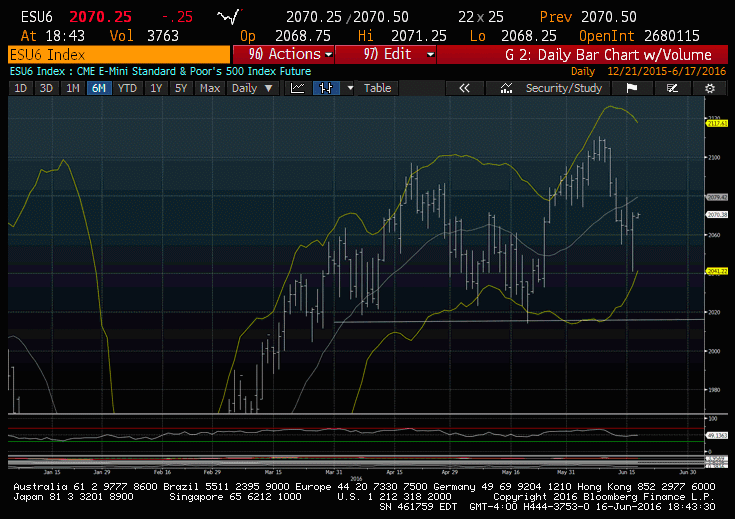
S&P 500 Futures
S&P futures managed to reverse sharply Thursday morning after brushing support to finish positive for the day, largely mimicking what happened in bond yields. For now, it remains premature to call for any low in this decline from 6/8, but indices do seem to be close to an area that could allow for a trend reversal to close out the month. In the short run, unless S&P finishes back over the area of the recent breakdown, near 2082, its more likely that lows should be retested, not only in Equities, but also in European equities, Treasury yields, and USDJPY in the days ahead, which would help form a more perfect low. However, given that US stocks closed within a few ticks of very good support, its not a MUST at this stage, so we’ll be watching carefully to see if prices can close up sufficiently, while using any dips into early next week to buy.
Gold
Gold’s reversal today was important, as it got just briefly over prior highs before pulling back hard nearly $35 from early highs to form a daily engulfing pattern with the prior few days. This key reversal looks likely to pullback further in the days ahead, and would accelerate lower additionally if the US Dollar index shows signs of exceeding May highs near 96. For now, it’s worth pointing out that this pattern is far different than most simple consolidations where highs are exceeded, as our recent advance came after a higher high and lower low, making it a far trickier pattern to simply buy breakouts in normal fashion. For the days ahead, weakness looks more likely than gains given Thursday’s reversal.
Visit NewtonAdvisor to learn more about my approach and services. Trade safe and thanks for reading.
Twitter: @MarkNewtonCMT
The author may have a position in mentioned securities at the time of publication. Any opinions expressed herein are solely those of the author, and do not in any way represent the views or opinions of any other person or entity.


