The end of year rally has trickled over into 2024 and it has been lead by tech stocks.
But has the rally gotten long in the tooth?
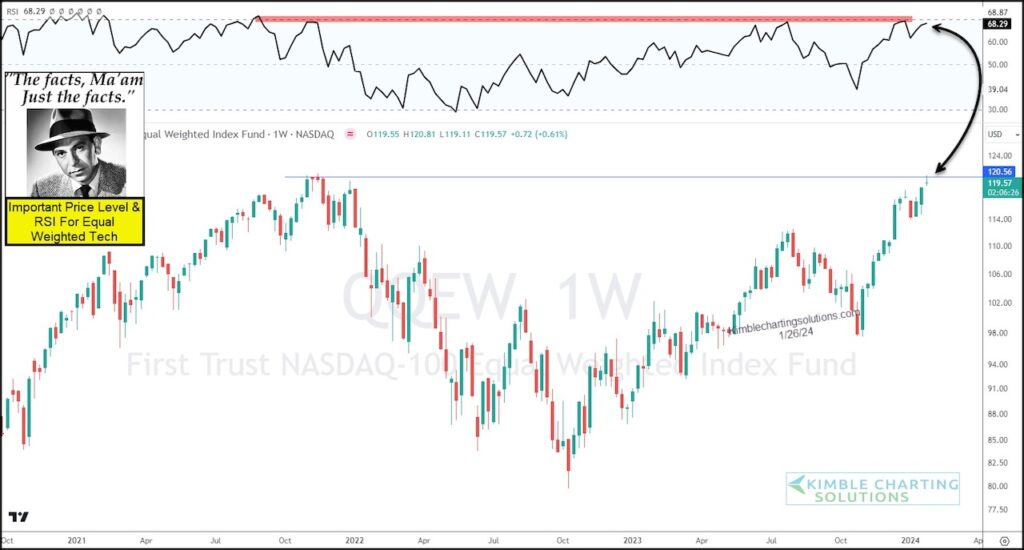
“The facts, Ma’am. Just the Facts.” – Joe Friday
Today’s “weekly” chart of the Nasdaq 100 Equal Weight Fund (QQEW) highlights an important obstacle for tech stocks: the 2021 highs sit overhead as price resistance.
And QQEW is hitting this level as its RSI indicator is at peak levels. Could this bring a pullback? Or will be see a breakout?
Ole Joe thinks this could be an important level for QQEW, and I think you should too. Stay tuned!
$QQEW Nasdaq 100 Equal Weight “weekly” Chart
Note that KimbleCharting is offering a 2 week Free trial to See It Market readers. Just send me an email to services@kimblechartingsolutions.com for details to get set up.
Twitter: @KimbleCharting
The author may have a position in mentioned securities. Any opinions expressed herein are solely those of the author, and do not in any way represent the views or opinions of any other person or entity.


