Looking across the U.S. stock market indices and sectors, one thing is apparent: Growth stocks are getting hit hard.
Just this week we wrote about a key “growth” indicator that was lagging.
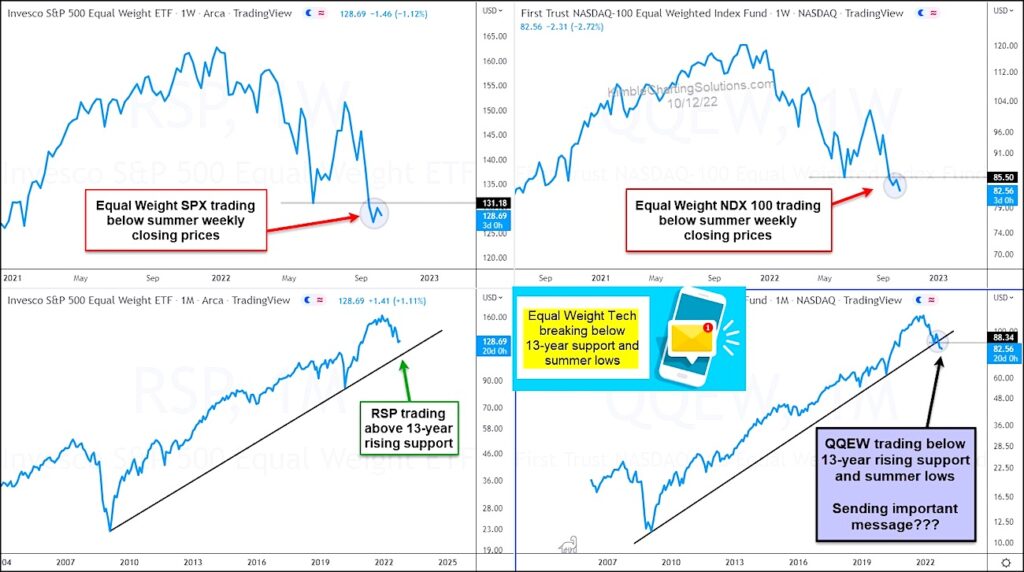
And one of the main spaces within the growth arena is technology stocks. And today’s chart highlights just how poor technology stocks are performing versus the broad market.
Below is a chart 4-pack showing the performance of the equal weight S&P 500 ETF (RSP) and equal weight Nasdaq 100 ETF (QQEW) on a “weekly” basis – the top 2 are near-term, while the bottom 2 are longer-term. As you can see on the top charts, both have fallen below their summer weekly closing prices, with the QQEW decline being deeper percentage-wise.
But the more revealing charts come in the lower panels, where we see that the S&P 500 equal weight $RSP is trading well above its trend line while the Nasdaq 100 equal weight $QQEW is breaking below its trend line.
Equal weight tech appears to be sending an important message as it breaks below its summer lows and 13-year rising support. This underperformance could drag the market lower yet. Stay tuned!
Equal Weight ETFs: S&P 500 vs Nasdaq 100 Charts
Note that KimbleCharting is offering a 2 week Free trial to See It Market readers. Just send me an email to services@kimblechartingsolutions.com for details to get set up.
Twitter: @KimbleCharting
Any opinions expressed herein are solely those of the author, and do not in any way represent the views or opinions of any other person or entity.


: Showing Some Signs of Emerging Strength")
