Let’s get right to it. The charts and our tools are telling.
First, I look at moving averages and phases.
Second, I look at Real Motion and momentum to see if there is a divergence to price.
Then, I check out our Leadership indicator which tells us how an instrument is performing against a benchmark. I look at weekly and monthly timeframes as well as the daily charts.
And now that it is relevant, I look at the calendar range. (See video we did for Stockcharts.)
Naturally, I have a few other considerations, but for now, we can go with these.
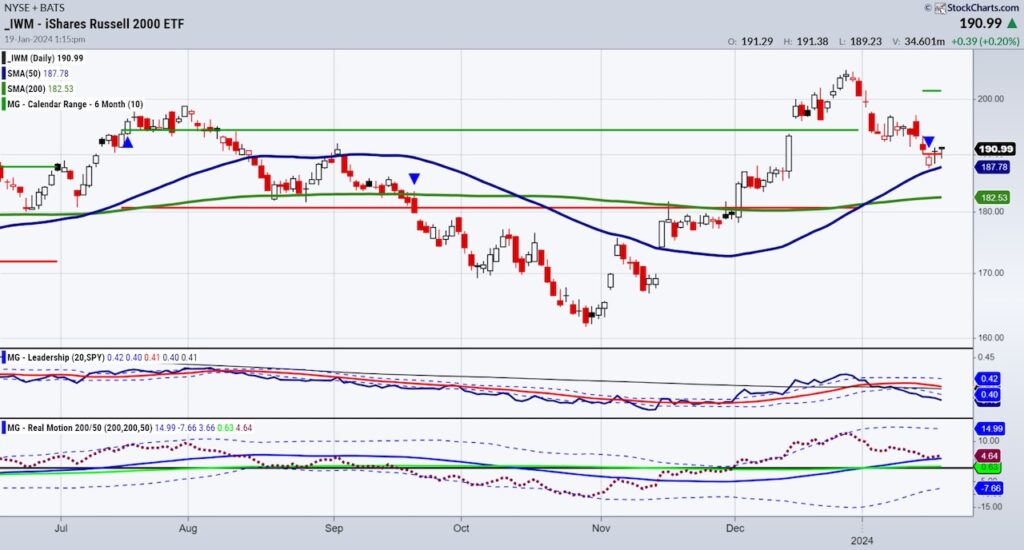
The Russell 2000 $IWM
Moving Averages on the Daily, Bullish. Momentum indicator shows no divergence as momo sits on the moving averages as does price. Leadership is weak, well underperforming the benchmark. Sustainable. Weekly charts show price on major support between 183-188.
The monthly chart shows a 2-year business cycle expansion (above the 23-month MA) with resistance at December 2023 highs.
The calendar range shows price sitting on the January lows or the very pivotal 190. Either an incredible low risk buy, or fair warning, especially considering this:
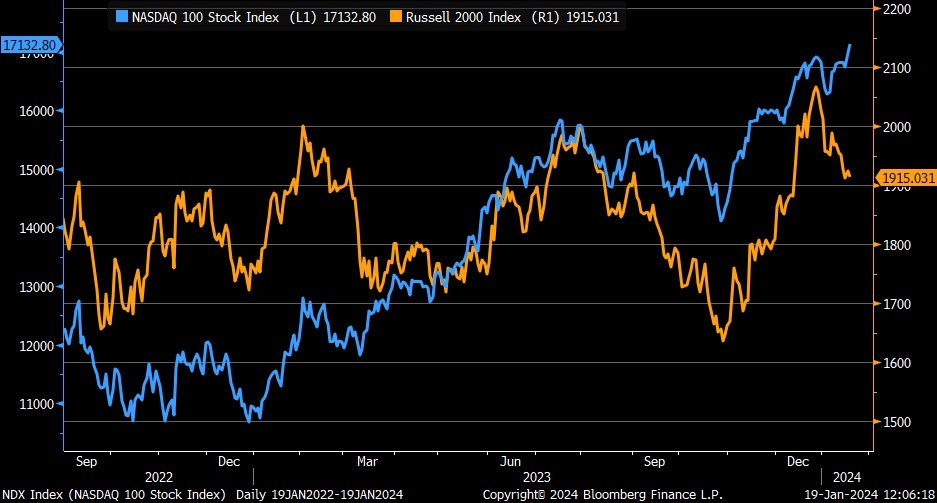
IWM’s struggle to keep up with growth.
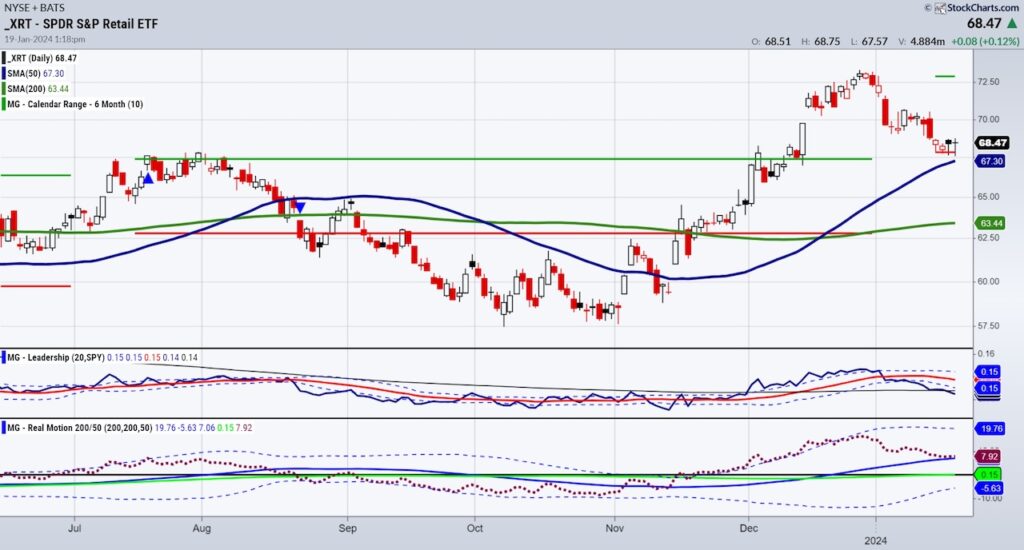
This is the Daily chart of Granny Retail XRT. The similarity between XRT and IWM is clear. Moving Averages on the Daily, Bullish. Real Motion shows no divergence as momentum sits on the moving averages as does price.
Leadership is weak, well underperforming the benchmark. Weekly charts show price on major support between 64-68. The monthly chart has price above the 23-month MA for the first time since 2021, while still far from the December 2023 highs.
The calendar range shows price sitting on the January lows or the very pivotal 68.00.
Both Gramps and Granny are critical components to the market and economy. Both reflect the rightful hesitancy for predicting the Fed’s next move on rates.
Both are well underperforming growth stocks yet sit on major support. I hope this gives you a guide to this week. It sure does it for me as I am watching carefully for the all clear in the overall market now that QQQs and Semiconductors have gone fast and furious.
Speaking of Sister Semiconductors is part of the Family, as are Biotechnology, Regional Banks, Transportation and Bitcoin. All have similar patterns to Gramps IWM and Granny XRT which tells us the whole Family has the engine idling and will either put themselves in gear or run out of gas.
Twitter: @marketminute
The author may have a position in mentioned securities at the time of publication. Any opinions expressed herein are solely those of the author and do not represent the views or opinions of any other person or entity.


