The U.S. equity markets have traded in a range as traders and investors await CPI data tomorrow.
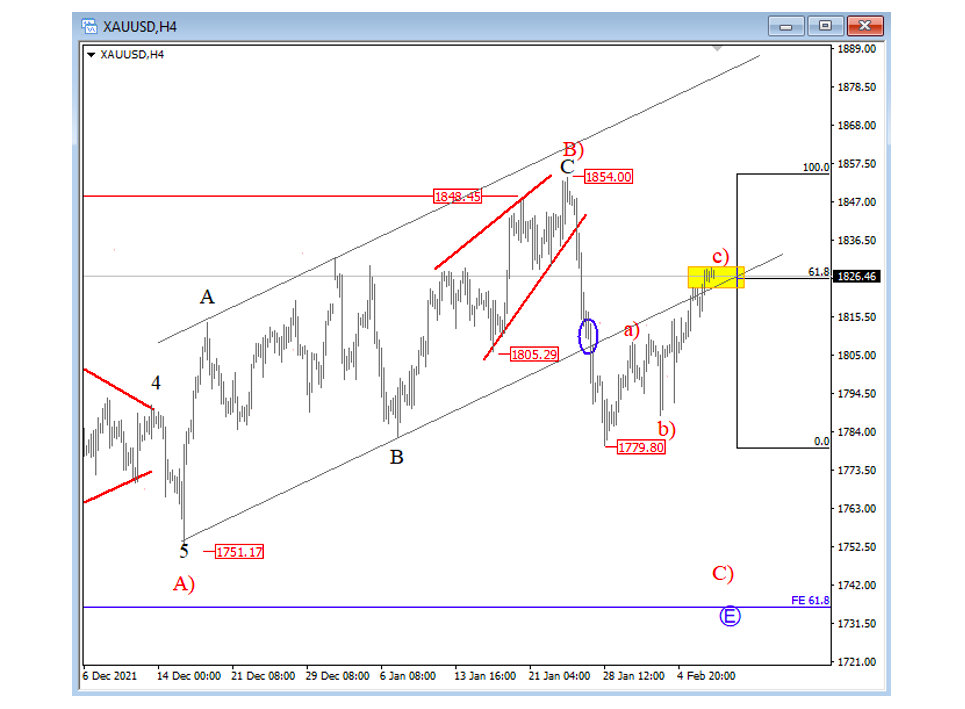
Gold made a sharp and strong turn down from 1850 area as expected after we noticed a completed ending diagonal in wave C of B). It’s a very strong decline with a break below the trend line support that suggests more upcoming weakness into wave C) of E.
Ideally, we will see a continuation down now, after an a)-b)-c) corrective rally into 61.8% Fibonacci retracement. A decline below 1800 will suggest we are seeing the waves correctly and gold is headed lower.
GOLD 4-hour Elliott Wave Analysis
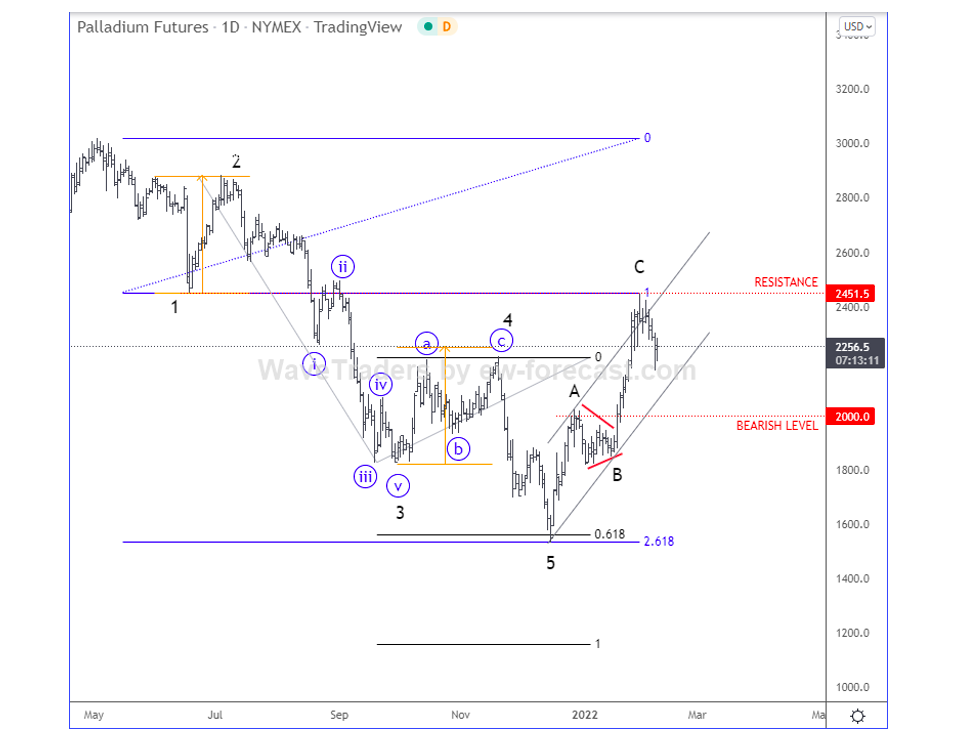
Palladium made a nice three-wave A-B-C correction after we noticed five waves of decline from the highs, so we may now have a nice bearish setup formation. If we are right about bearish looking gold and silver, then even Palladium could sells-off, but keep in mind that bearish confirmation is only below 2000 level.
Palladium Daily Elliott Wave Analysis
Twitter: @GregaHorvatFX
The author may have a position in the mentioned securities at the time of publication. Any opinions expressed herein are solely those of the author, and do not in any way represent the views or opinions of any other person or entity.


 Set For Revival?")


 Set For Revival?")
