Waning Macro Market Momentum Indicates It Is Time To Row, Not Sail
From October 17 – November 28, 2014 the S&P 500 closed 29 consecutive days above the 5-day moving average. It was the longest streak of equity market momentum in the history of the index, surpassing the previous record of 27 days set in 1928. Underlying the surge into early November was a grand orchestration of policy announcements and rumor mongering from the large central banks clearly intended to arrest any potential sell-off that could be ignited by the official end of the Federal Reserve quantitative easing program on October 31, 2014. Click images to enlarge.
SPY – 60 Minute Chart
Since the end of the record setting momentum surge of October – November 2014 the S&P 500 has been trading with indecision. From the November 28, 2014 close to the June 1, 2015 close the index has gained just +2.1%. Click to enlarge chart.
S&P 500 – Daily Chart
Four-Year Cycle – S&P 500
“Since 1949, the stock market has made major lows every four years pretty much like clockwork: 1949, 1953, 1957, 1962 (which was an exception), 1966, 1970, 1974, 1978, 1982, 1987 (a second exception), 1990 (eight years after the 1982 low, so not an exception), 1994, 1998, 2002, and 2008 (a third exception). I first started writing about these exceptions in 2007, when we were dealing with another one. At that time I called the two previous exceptions to the four-year major low rule that we experienced in 1957-1962 and 1982-1987 “Bull Market Extensions”, because the scheduled major low was pushed forward in both cases.” – Walter Deemer
Based on the cycle low of 2009 the S&P 500 should have printed a defined an important low sometime in early 2013. Instead, the index has continued to print bull market highs as recently as May growing the duration of the ‘Bull Market Extension’. The last three bull market extensions were resolved with the 1962 Crash (-29% Decline), the 1987 Crash (-41% Decline) and the 2008 Financial Crisis (-58% Decline). Click to enlarge chart.
‘Killer Wave’
“A technician named Don Hahn observed another phenomenon about the Coppock Guide. When a double-top occurs without the Coppock falling to zero, it identifies a bull market that hasn’t experienced any normal, healthy wash-outs or corrections. That’s a runaway bull market usually headed for disaster. There is a critical historical aspect to double-tops: They can result in nasty bears!” – James Stack
It is widely pointed out that the Coppock Curve has a history of successfully timing important market bottoms (noted with green arrows in the chart below), but it also has a solid record of projecting major tops. Currently, the momentum oscillator is indicating that the secondary momentum of the current secular bull market leg has peaked and it is time to entertain the idea that an important cyclical top is near. Click to enlarge chart.
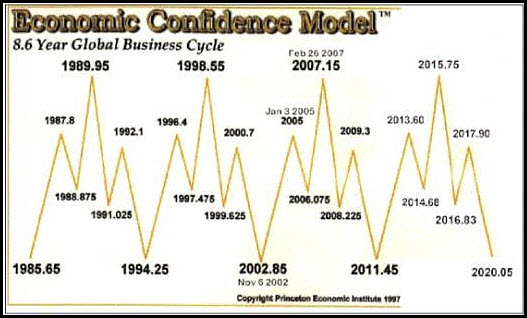
Economic Confidence Model
Models and indicators are never perfect, but the peaks of the Economic Confidence Model do match closely with important inflection points for the financial markets.
- 1989 – Savings and Loan Crisis bailout plan.
- 1998 – Russia Debt Crisis / LTCM Liquidation
- 2007 – Real Estate Bubble Top
- 2015 (Projects September 30) – Emerging Market Debt Crisis Thanks To U.S. Dollar Strength?
Historical Precedents
I recognize that a bearish interpretation of the recent price action flies in the face of several bullish historical precedents.
- The S&P 500 following the mid-term election (November 4, 2014) is up +15.6% on average 100% of the time 12 months later. (Yardeni)
- Since 1898 the Dow Jones Industrial Average has an average return of +34.6% in years ending in ‘5’. (Leuthold)
- Since 1898 Dow Jones Industrial Average has an average return of +44.7% in pre-election years ending in ‘5’. (Leuthold)
- BofA Merrill Lynch Global Research collaborates the work of Leuthold regarding years ending in ‘5’ for the Dow Jones Industrial Average and the S&P 500.
One contrasting historical precedent is that since 1871 the S&P 500 has never risen 7 consecutive years in a row. Period used is from June 30, 1874 – December 31, 2014. The only other 6 consecutive years of positive returns was 1898 – 1903. The S&P 500 corrected -18% in 1904. (DoubleLine)
2015 is a face-off between bullish historical precedents and clear signs of waning macro momentum. To date, the collision has manifested itself in a churning price structure. I interpret the price action so far this year as part of a long, deceptive topping process.
For the last six years we’ve had the benefit of the wind behind our sails. It is my view that market participants need to shift from sailing to rowing (Ed Easterling “Unexpected Returns”).
References:
- Charts created on StockCharts.com.
- Economic Confidence Model from Princeton Economics.
- Performance tables sourced from BoA Merrill Lynch Global Research.
Twitter: @hertcapital
No positions in any of the mentioned securities at the time of publication. Any opinions expressed herein are solely those of the author, and do not in any way represent the views or opinions of any other person or entity.


