 The month of June has been widely cited this year as a seasonally weak period for stocks, particularly because 2014 is a mid-cycle election year. At +1.92% month-to-date, however, June 2014 is hardly measuring up to the calendar’s prescribed pessimism.
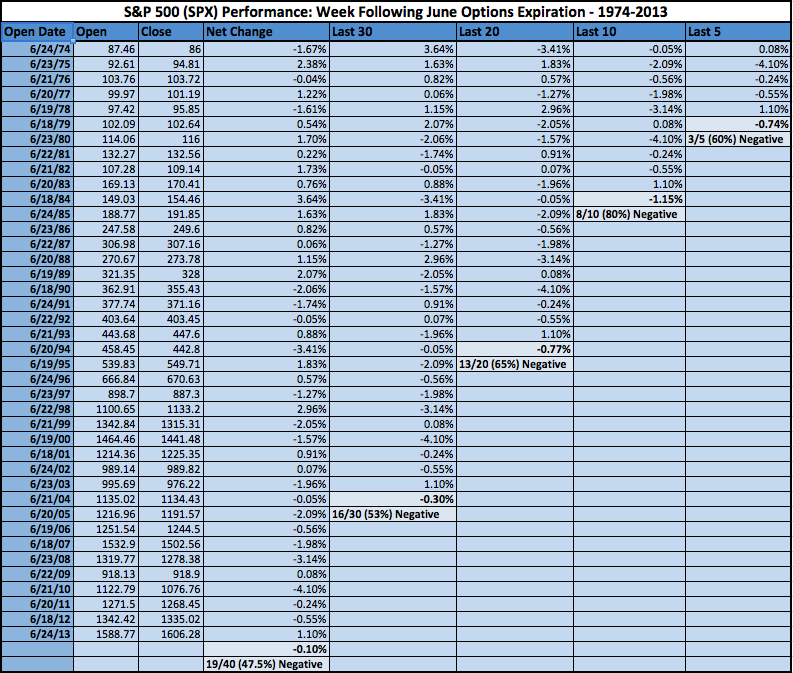
Stocks may take a turn back toward their historical mean this week, however. The week following June equity options expiration more than affirms June’s poor reputation, registering average net weekly performances of -0.74%, -1.15%, -0.77%, -0.3%, and -0.1% over the last 5, 10, 20, 30 and 40 years, respectively. Since 1974 cumulative average performance has generally deteriorated during this week; and over the last 20 years the ratio of winners to losers has been especially bad.
Some more recent highlights: the last 8 of 10 (2004-2013) weeks have been negative, averaging -1.59% among them while the 2 that have finished higher (2009, 2013) averaged +0.59%. Zooming in to the last 5 years (2009-2013) the ratio of winners to losers improves, but performance worsens with 3 of 5 negative at an average -1.63%.
Twitter: @andrewunknown and @seeitmarket
Author holds no position in securities mentioned at the time of publication. Commentary provided is for educational purposes only and in no way constitutes trading or investment advice.


