 For the past week it has proven impossible for all but the most assiduous reader of market-related content to avoid prognostication about how much damage the nexus of dire geopolitical and macro variables that is September will inflict on equity markets.
In case you’ve missed it, articles like this one – Why This September Could Be the Worst Ever for the Stock Market – are fairly representative. Helpful as a brief map of the rocky shoals stocks will be forced to navigate through; and a scary conclusion that laughably overreaches the sum of its parts.
But is this sense of anxiety limited to the usual contrived click-bait, chicken little market copy; or have genuine metrics of market sentiment taken a turn, many from multi-year highs attained as the S&P 500 (SPX) capped out above 1700 in early August?
The correct answer is: “a bit of both”.
Wider consumer sentiment – according to such metrics as the University of Michigan Consumer Sentiment poll and The Conference Board’s Consumer Confidence Index – softened in August, but only modestly. In moderate contrast, the latest sentiment reads from among market participants as measured by such polls as AAII, Investors Intelligence and NAAIM is flashing a yellow light. Sentiment as interpreted through NYSE Margin Debt – though it comes late (data is released around the 25th for the prior month) – remained negligibly off its April 2013 all-time highs in July. Similarly, the Equity Put-to-Call Ratio closed yesterday below its 4-week simple moving average of 0.6 at a quiescent 0.54 – nearly the bottom of the range it has moved in since early 2011.
Overall then, general consumer and market-specific sentiment data has held up as you would expect in an environment characterized by an SPX at or just off its all-time high.
But it’s important to remember that even while confidence cross-pollinates closely with asset prices, improving sentiment is not unlike following a swiftly ascending route to a mountain summit, facing backward. Margin Debt and the Put-to-Call ratio, among other metrics are indicative of the virtuous feedback loop obviously underway in the other measures mentioned, but also carry a nuance of short-to-medium term complacency.
With that in mind, consider this. Though it’s new (introduced March 2013) and as yet has some modest methodological challenges, one measure that is closer to coincident with the market than any of those mentioned is Stocktwits’ symbol-specific sentiment charting. Dialing in to my market proxy of choice, the Ishares Russell 2000 ETF (IWM), we find this:
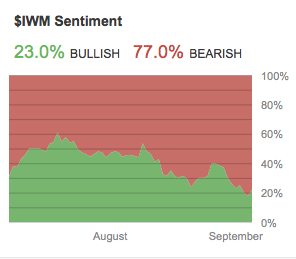
Not only did ST’s sentiment chart comfortably tag IWM‘s all-time high, it set up a negative sentiment divergence between the 07/22/13 lower and 08/05/13 higher highs in price. In its short life, sentiment among those actively posting and tagging charts on IWM at Stocktwits has never been more bearish. Since the data series is in its statistical infancy, any observations must be taken with an analytical grain of salt. But for what it’s worth, this view of IWM – recalling that small caps have lead much of 2013’s broad market advance – is in startling contrast to the “slower” metrics mentioned earlier – and may indicate the complacency inherent in all-time high NYSE Margin Debt and a bottoming put to call ratio is starting to work itself out into topping prices. Or, it may be pointing to an excessively bearish market ripe for reversion.
Geopolitical instability with Syria as the proxy theater and the prospect of a military incursion very in America and abroad seem to want. A market convinced the Fed is about to end the Age of Accommodation by starting the QE taper – along with a 10 year T-Note yield knocking on 3%. A potential budgetary debacle that is a building echo of the dire days in early August 2011. Highly confident, perhaps highly complacent sentiment metrics paired with a more immediate – and too decisive? – bearish outlook in a benchmark market leader to-date. And don’t forget the overwhelmingly bear-weighted seasonality in play during September.
It all sounds like a plausible recipe for a shockingly deep correction for an overly-ripe bull market.
But what if September is the over-hyped market calamity that never occurs? What if – despite the widely-discussed odds heavily stacked against it – equities do the opposite of what they ought to and rocket higher?
That – not a deepening pullback – would be the real shock.
Russell 2000 (IWM) – Daily: “Will History Rhyme, Again?”
How might this positive shock look? If 2013 in general and the activity from mid-July to the present in particular are any guide, what comes next may look strikingly familiar. Just IWM experienced 6-8% consolidation pullbacks in March-April and May-June, August-September is experiencing a similar pullback, both in duration and measurement peak-to-trough. The year-to-date Daily chart of IWM presented below is so symmetrical it seems to resemble a textbook rendering of a pattern (click image to zoom):
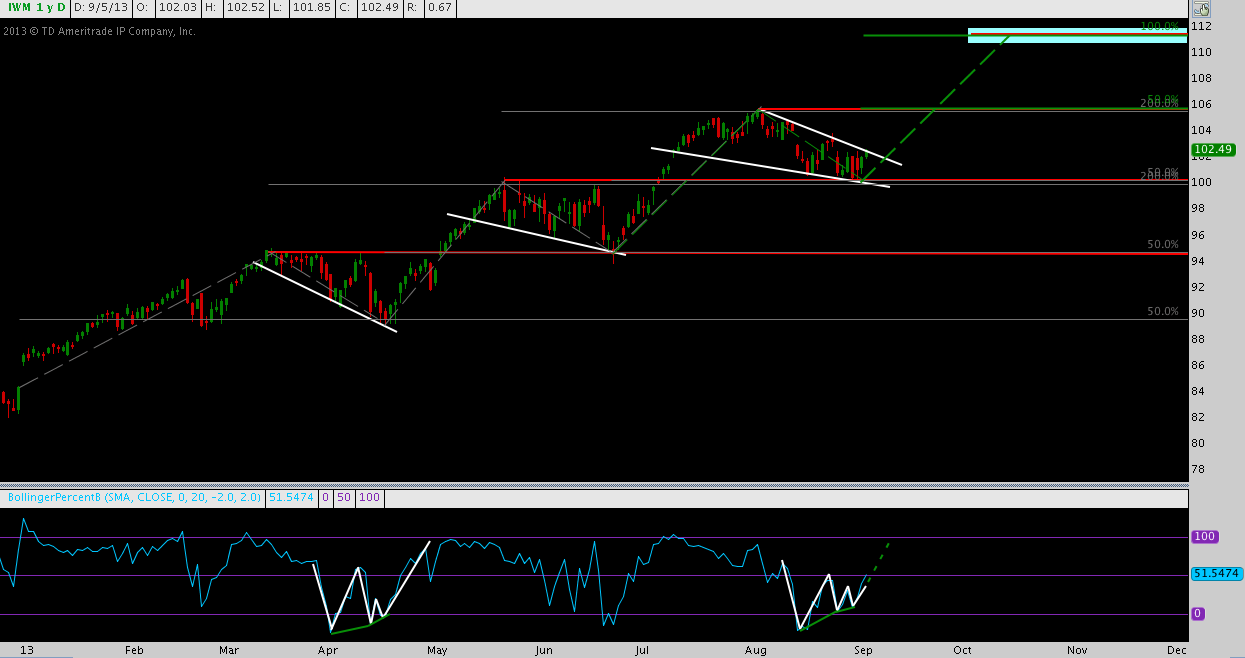
What results is an advance followed by a 50% retracement some 5-6 weeks in duration, then followed by an advance of similar duration to the pullback; and there the cycle begins anew. Three advances in 2013 YTD have occurred, followed by three pullbacks. In the cases of pullbacks 1 and 3, the positive momentum signature present in 1 (see lower chart panel) is being mimicked turn-for-turn in 3.
On that basis, Advance no. 4 plots a target of just shy of 112. Extrapolating for time, this level gets tagged approximately one month out. +10% in 5 market weeks? From here? Did I mention a positive shock? Why not: just this scenario has played out twice in the past 6 months already.
An alternate view (which I half-jokingly – but only half – call “mocking randomness”) of the succession and potential projection goes like this:
Russell 2000 (IWM) – Daily: “100% Steps forward, 50% Steps Back”
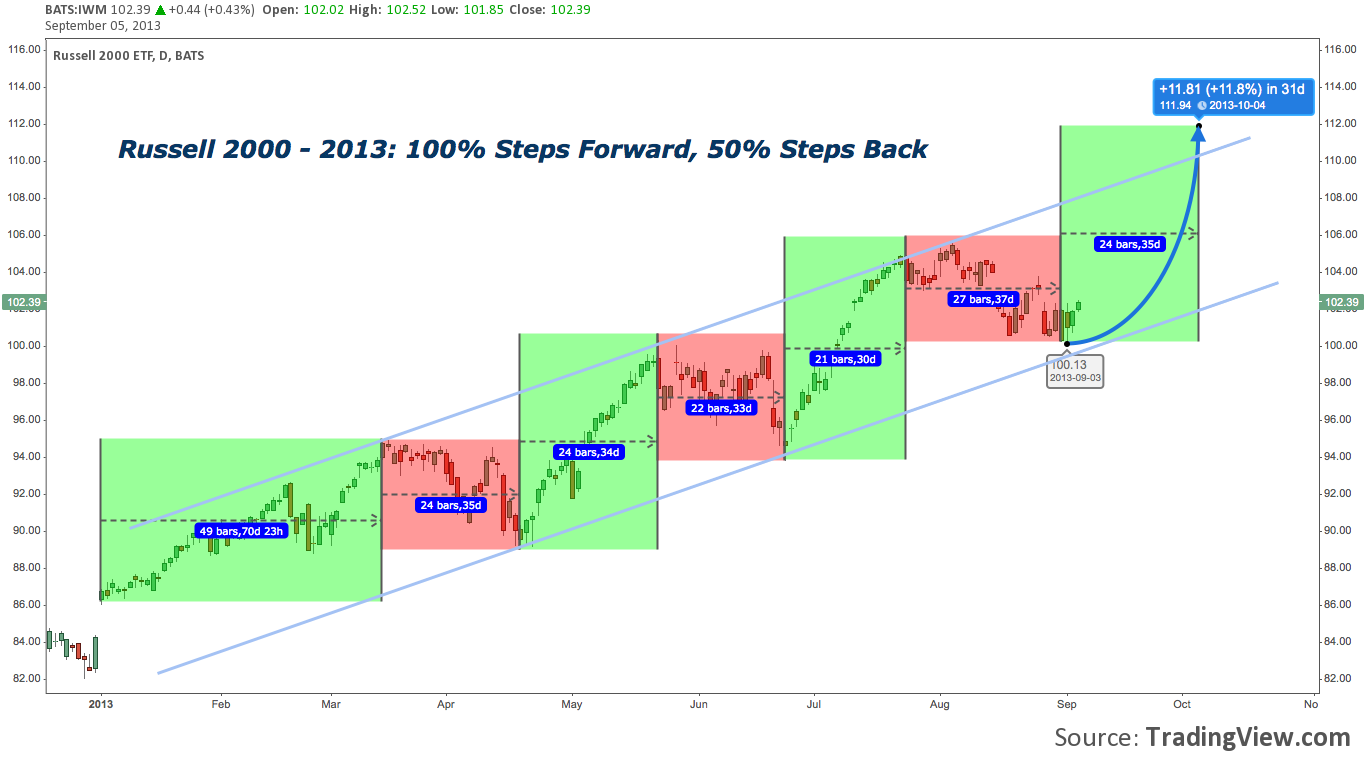
Caveat lector: keep in mind, this isn’t being proffered as a forecast or market call on IWM or broad equities in general; but a simple, “all other things being equal” (a dangerous phrase when applied to analysis if living, breathing markets) extrapolation based on observation of the past. In a rapidly evolving context with so many moving parts and an ambivalent cocktail of consumer optimism and market pessimism, an improbable fourth recurrence of the same dominant technical motif YTD – read: boring repetition – actually has a shot. Remember that price has a vivid memory; and thoroughly mapping it can provide a well-defined edge.
Twitter: @andrewunknown and @seeitmarket
Author holds net long Russell 2000 exposure at time of publication.
Any opinions expressed herein are solely those of the author, and do not in any way represent the views or opinions of any other person or entity.


