The economic effects of the coronavirus are far and wide.
But much of the changes that are glaring today are social behavior trends that were already set in motion… now on daily fast forward.
The move to from the industrial age to the technological/robotic age has been in motion for years. But a peak at what we thought the world would be in 10 years is here right now.
And we weren’t ready for the speed of it… and it will likely spell the demise for several brick and mortar businesses, as well as mom and pops that weren’t prepared for quick service and takeout. And hurt commercial real estate. We had a gradual shift from the agrarian economy to the industrial age. Something similar may be afoot, but not so gradual. Today I simply share a few charts showing the leaders and laggards to highlight this change and punch in the gut (for certain industries) from the virus.
Note that the following MarketSmith charts are built with Investors Business Daily’s product suite.
I am an Investors Business Daily (IBD) partner and promote the use of their products. The entire platform offers a good mix of technical and fundamental data and education.
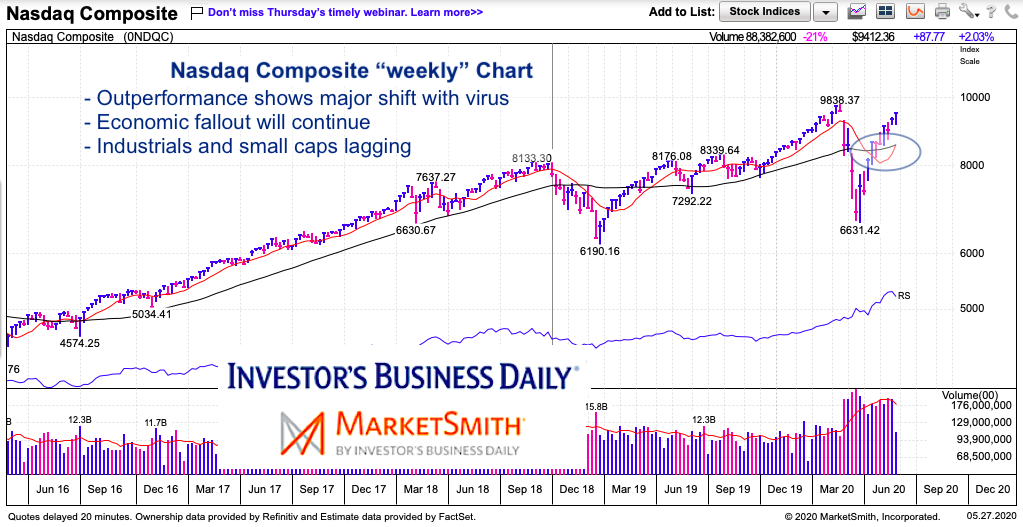
Nasdaq 100 Chart
Tech is the clear leader – near all-time highs.
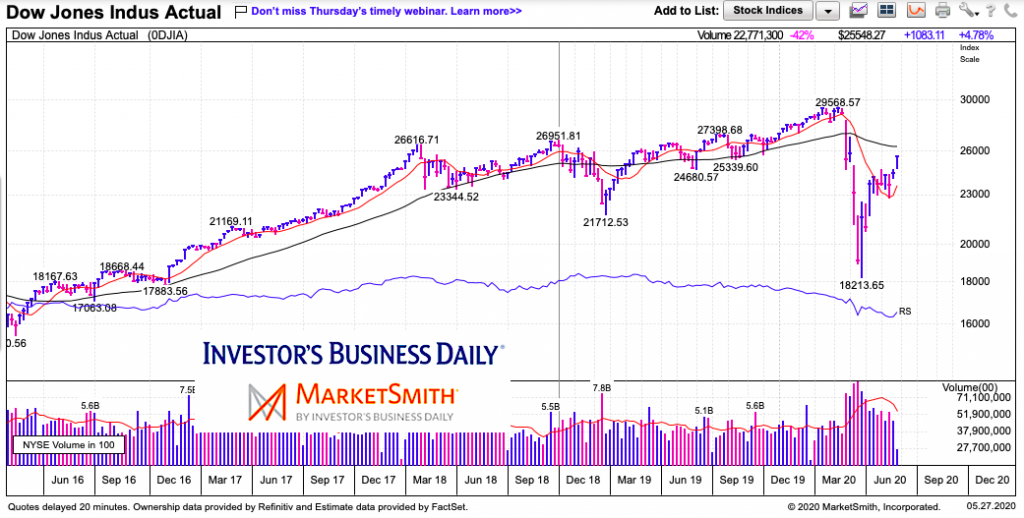
Dow Jones Industrial Average Chart
Industrials lagging the leader.
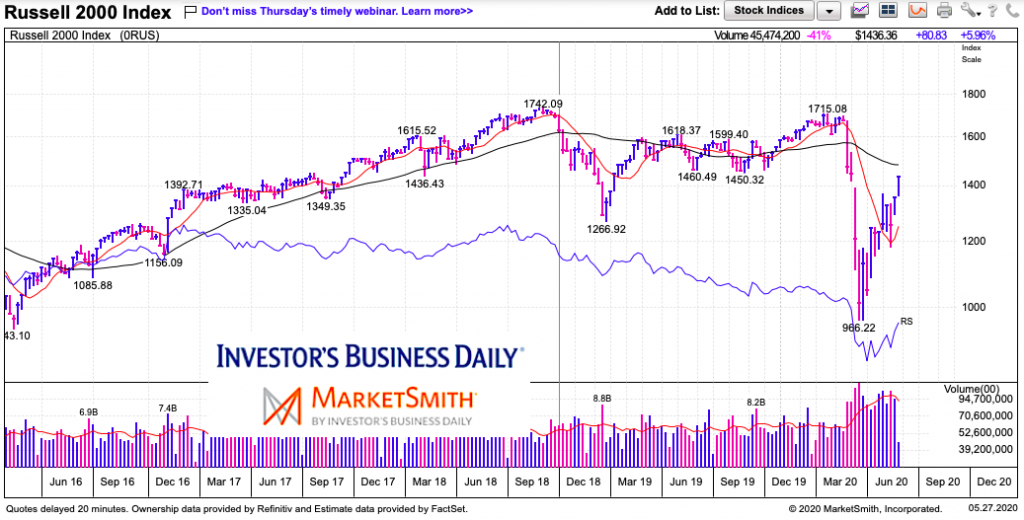
Russell 2000 Chart
Small caps lagging the leader. Small cap “tech” faring better though.
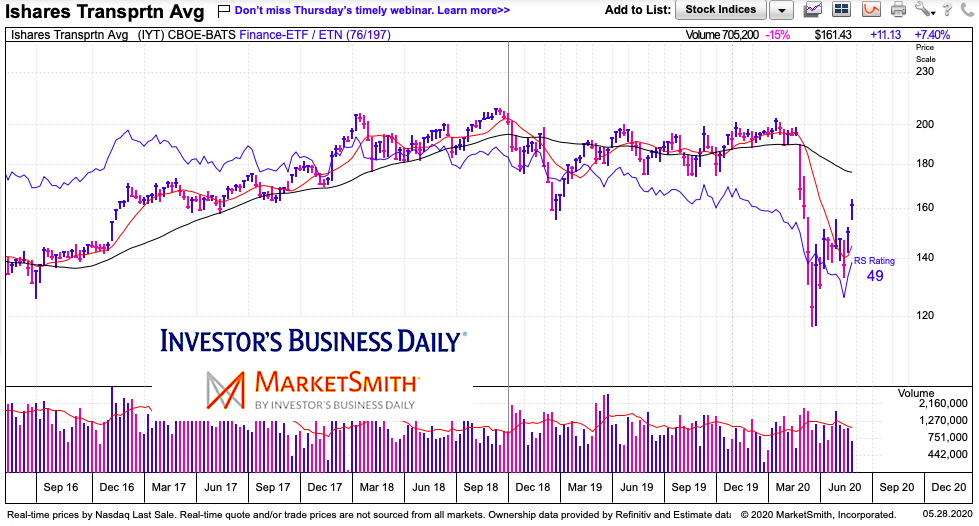
Transportation ETF (IYT) Chart
Trying to play a bit of catch up this week but still way behind.
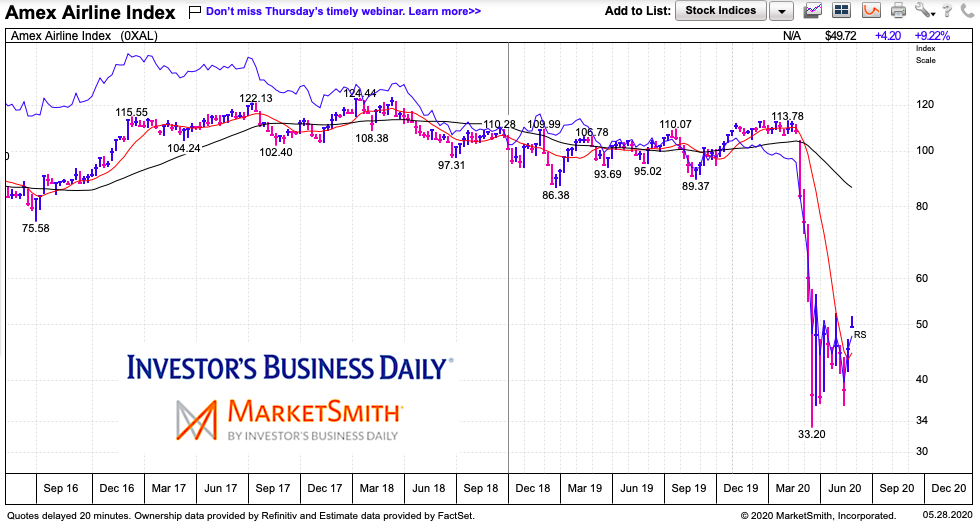
Airline Index Chart
Yikes, not a good outlook for the airline industry.
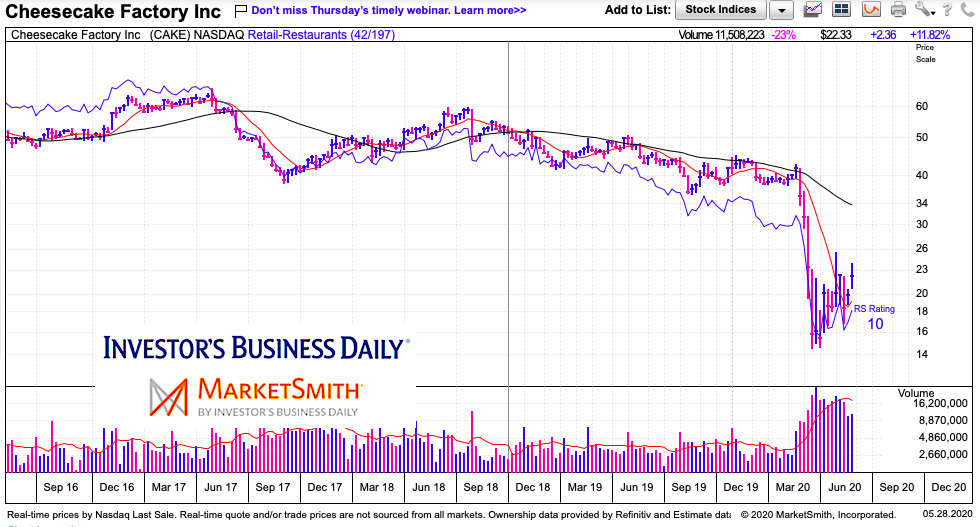
Cheesecake Factory (CAKE) Chart
Brick and mortar restaurants are hurting (and my not be quite what they were going forward). This is just one example. Businesses that were delivery (pizza), quick service (takeout), or fast food with good systems (McDonalds) are faring better and likely can transition better.
Twitter: @andrewnyquist
The author may have a position in mentioned securities at the time of publication. Any opinions expressed herein are solely those of the author, and do not in any way represent the views or opinions of any other person or entity.

 Rolling Over At Key Fibonacci Level?")


