We are close to finishing out the historically bearish period of seasonality for equities. And while we didn’t see any kind of crash that many traders were expecting, the S&P 500 (NYSEARCA:SPY) is up nearly 4% and saw just a 5% drop back in June.
Overall, it wasn’t a terrible summer for equities when all things considered.
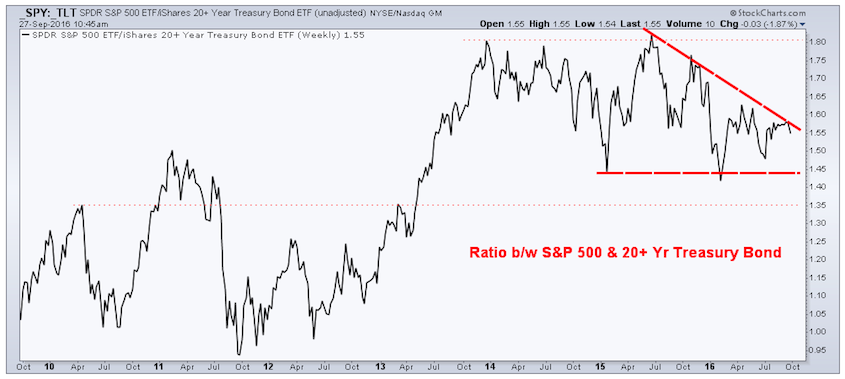
The chart I’d like to discuss today is of the weekly un-adjusted (not accounting for dividends) ratio between the S&P 500 ETF (SPY) and 20+ Year Treasury Bond ETF (NASDAQ:TLT) over the last seven years. This tells us how the stock market is performing relative to the bond market.
As a reminder, when $SPY is outperforming $TLT the line rises and when the opposite happens the line declines, this doesn’t mean equities are appreciating, it simply shows which data set is rising more (or falling less) than the other.
I think it’s important to monitor the relationship between stocks and bonds and that’s exactly what this chart helps us do. The stocks bonds performance ratio between has been in somewhat of a range since late-2013 as it has been unable to produce a meaningful new high or lower lows. This creates a consolidation triangle pattern that we can view as levels of support and resistance with regards to the relative performance of $SPY and $TLT.
As the chart below shows, the ratio has found prior support at 1.45, which if broken could see a decline down to 1.35. This support area is the last significant area of price memory (2010 turning point and 2013 slight decline). On the upside we have a declining trend line connecting the lower highs since 2015. A break here could see $SPY outpace $TLT with the ratio rising back to its prior high around 1.80.
To better gauge a break of either resistance or support (one will eventually have to happen whether it’s due to pacing of time or price movement) I’ll evaluate trend strength (not shown on chart) to better understand the potential the break has ‘staying power’ and the potential of a false break or reversal. But at this point, we have our levels and can be patient, allowing the market to dictate a bias.
Thanks for reading.
The information contained in this article should not be construed as investment advice, research, or an offer to buy or sell securities. Everything written here is meant for educational and entertainment purposes only. I or my affiliates may hold positions in securities mentioned.
Twitter: @AndrewThrasher
Any opinions expressed herein are solely those of the author, and do not in any way represent the views or opinions of any other person or entity.


