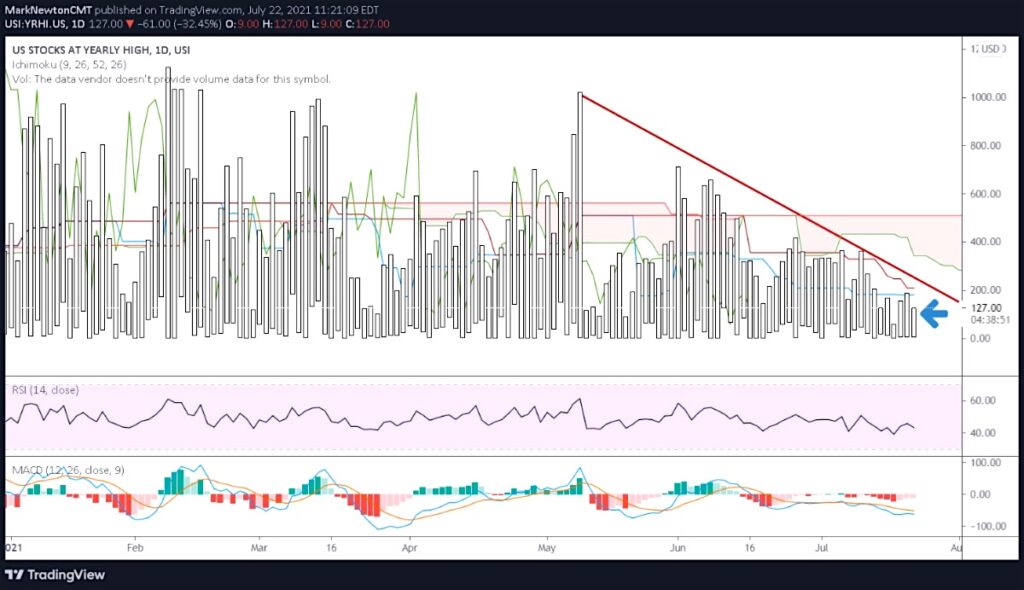
The number of US Stocks at new Yearly highs has now dropped to just over 100 after having been over 1000 a couple months ago.
This has seen a steady decline and mirrors other polls such as Percentage of stocks being above 50-day moving average as having dropped down to 50%.
Some might choose to ignore this and simply concentrate on TWTR, SNAP and large-cap technology stocks and ignore the rest of the market. I think one can see it both ways.
Large cap tech stocks dominate the market, therefore Big-cap Tech IS the market and only until this gives way should investors care. Or Mid and Small caps are dropping off sharply with Transports and Financials and THIS is importnat to concentrate on. I would agree that both points have merit. However, the same thing happened last February 2020 when Equal-weighted markets peaked out in January and the Nasdaq 100 and S&P 500 pushed up into February. Arguably, sentiment is a bit more subdued in recent weeks, but important to monitor.
If you have an interest in reading more thorough technical research twice a day, please visit NewtonAdvisor.com. Additionally, feel free to send me an email at info@newtonadvisor.com and I’d be happy to send you copies of recent reports or add you to a trial of my work. Individual and Institutional clients are shown pre-market thoughts on several markets and asset classes, mid-day thoughts and long/short ideas at @MLNewtonAdvisors (private Twitter). Email for details.
Twitter: @MarkNewtonCMT
The author may have a position in mentioned securities at the time of publication. Any opinions expressed herein are solely those of the author, and do not in any way represent the views or opinions of any other person or entity.


: Showing Some Signs of Emerging Strength")
