Midday, after the market had melted down earlier in the day, I read these tweets:
BREAKING: Trump says he has not yet decided to go forward with more tariffs on $325B of China goods
JUST IN: Trump says he will meet with China’s Xi and Russia’s Putin at G-20 summit
Can you guess what the stock market did?
Of course you can.
The stock market came off the lows with fresh buying because why not keep playing the sell the after-the-market closes news and buy the while-the-market is open news.

Are we traders now living a pipe dream?
A pipe dream is an unrealistic hope or fantasy.
The photo to the right by Will Dubby Fuqua Artist at the Arnold Lieberman Collection
But do not let me burst your bubble or pipe. Let’s look at the weekly charts again.
Reminder: Most of my work comes from the Economic Modern Family and Market Phases. All of this is covered in my new book. To order Plant Your Money Tree: A Guide to Growing Your Wealth! Go here: www.moneywithmish.com and receive a special $97 bonus for free while it lasts!
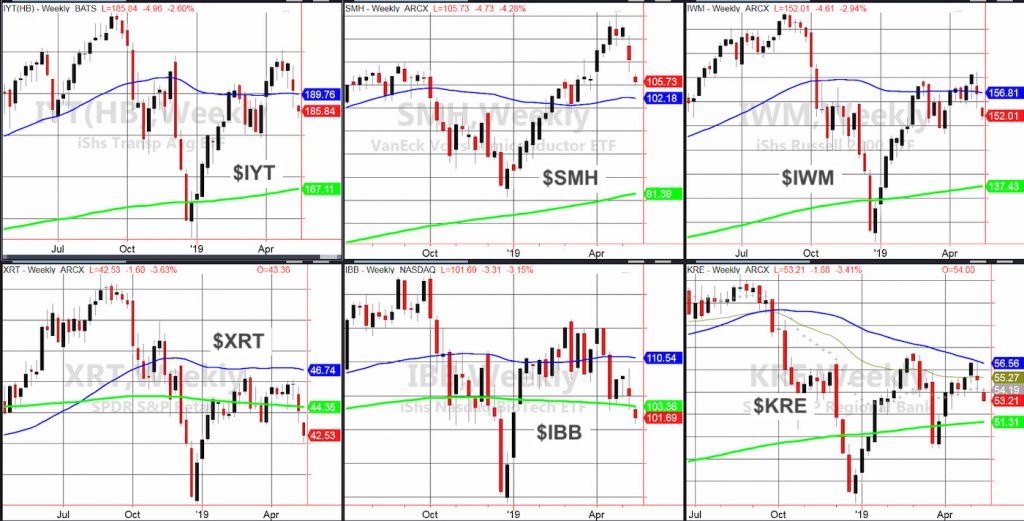
If you compare this chart to the same chart I posted over the weekend, you will notice some stark (I must have Game of Throneson my mind) differences.
The Transportation ETF (IYT) went from holding the 50-week Moving Average (blue line) to failing it.
The Russell 2000 ETF (IWM) went from marginally failing the 50-WMA, to significantly failing it.
The Retail Sector ETF (XRT) went from marginally failing its 200-WMA (green line) to miserably failing it.
The Biotechnology Sector ETF (IBB) went from holding its 200-WMA to failing it.
The Regional Banks ETf (KRE) failed the two gray lines or EMAs, and moved further away from its 50-WMA, heading closer to the 200-WMA.
Only Semiconductors SMH continues to hold the 50-WMA and the weekly bullish phase.
What does that mean?
Any sustained bounce, real or pipe dream imagined, go to SMH for strength.
Any continued weakness, you have five viable choices for choosing shorts.
Finally, in the commodities world, wheat and corn may have bottomed. Same thing with sugar.
If that is the case, good time to keep eyes on the ridiculously oversold DBA or Invesco DB Agriculture Fund.
S&P 500 (SPY) – Went into an unconfirmed caution phase. That makes 285.73 the 50-DMA super pivotal with 277.30 the 200-DMA next support.
Russell 2000 (IWM) – 155.30 now resistance while in an unconfirmed distribution phase, 150 is the next support area.
Dow Jones Industrials (DIA) – 254.22 the 200-DMA and now pivotal area to clear or not. Plus, in an unconfirmed distribution phase with next support at 252.46 the March 11 low.
Nasdaq (QQQ) – The 50-DMA is at 182.74 now resistance as this went into an unconfirmed caution phase. 174.30 is the underlying 200-DMA.
KRE (Regional Banks) – 54.20 now resistance with this in an unconfirmed bearish phase. 51.31 the 200-WMA
SMH (Semiconductors) – Unconfirmed caution phase. 102 the biggest support and now oversold with 107.35 resistance.
IYT (Transportation) – Unconfirmed distribution phase with 189.50 resistance and under 183.80, 180 best next support.
IBB (Biotechnology) – 103.50 the 200-WMA now resistance and 100 next best support.
XRT (Retail) – Some support at 42.00.
Twitter: @marketminute
The author may have a position in the mentioned securities at the time of publication. Any opinions expressed herein are solely those of the author, and do not in any way represent the views or opinions of any other person or entity.


 Ready To Break Out?")