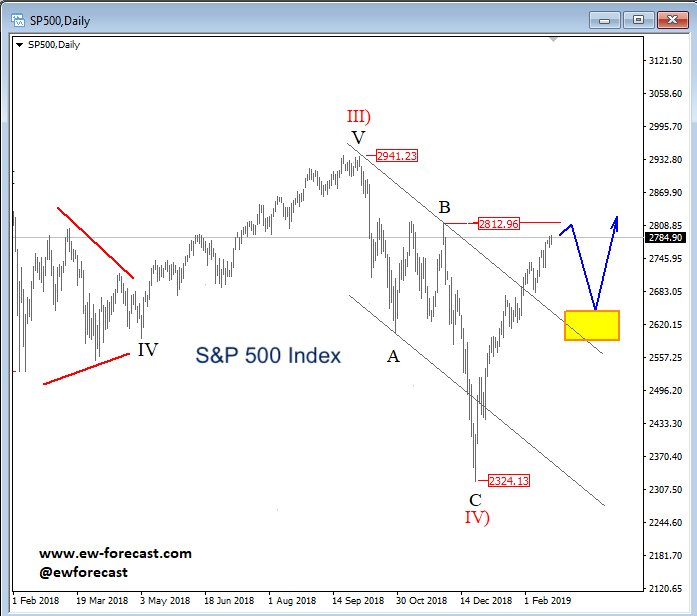
The S&P 500 (NYSEARCA: SPY) appears to have completed a corrective decline, one that began in September of 2018 and ended in late December.
The decline unfolded in a three-wave drop within a higher degree Elliott wave IV.
We can see that wave IV found a base at the 2318 level, from where a new impulsive recovery is unfolding.
This is known as a continuation of an uptrend, so we assume that new all-time highs will be forthcoming.
However, nothing moves in straight line. So traders need to be aware of pullbacks. Ideally, the current rise will look for a temporary limited upside near the 2813 level, where the former swing high can react as resistance.
The pullback should find solid support lower around 2600/2650.
S&P 500 Index Chart
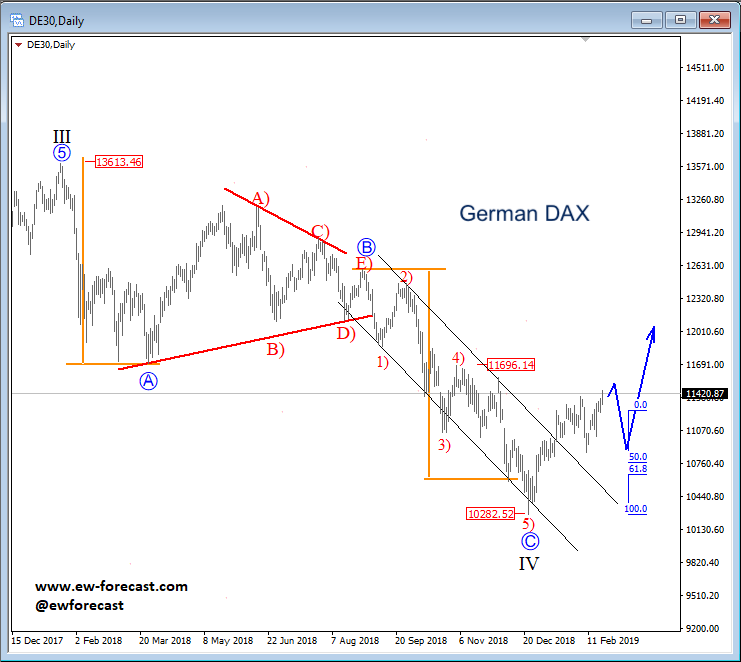
The German DAX is trading similar to the S&P 500, now ideally unfolding in a minimum recovery of three-waves from the 10282 level.
This move that can resume towards 11700 as first upward objective, followed by 12000. There is strong support for the DAX on deeper pullbacks down around the 10800 level.
German DAX Chart
If you like my Elliott Wave analysis, then I welcome you to visit my website and check for more content. Trade well.
Twitter: @GregaHorvatFX
The authors may have a position in the mentioned securities at the time of publication. Any opinions expressed herein are solely those of the author, and do not in any way represent the views or opinions of any other person or entity.


