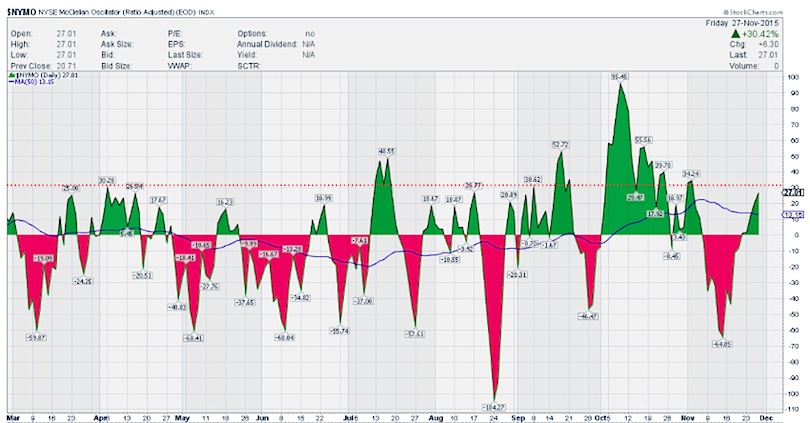
NYMO (McClellan Oscillator):
The McClellan Oscillator (NYMO) has slowly but steadily crept above the zero line and that is bullish.
It finished the week at 27.01. In the mean time, NYSI (not shown) has made a bullish cross and has started to turn higher as well.
This should bode well for the upcoming sessions.
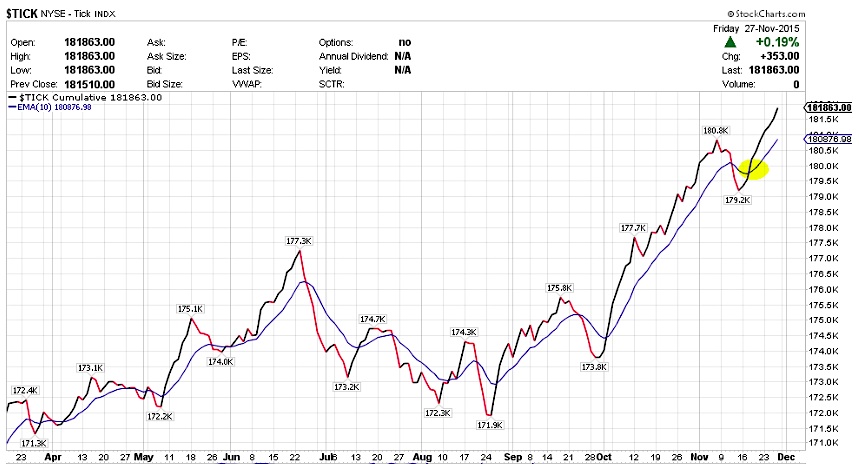
TICK / TRIN market indicators:
TICK continues to rise over and above its 10 EMA line. With some consolidation a.k.a back and forth filling expected in the upcoming sessions, keep an eye on for negative ticks intraday.
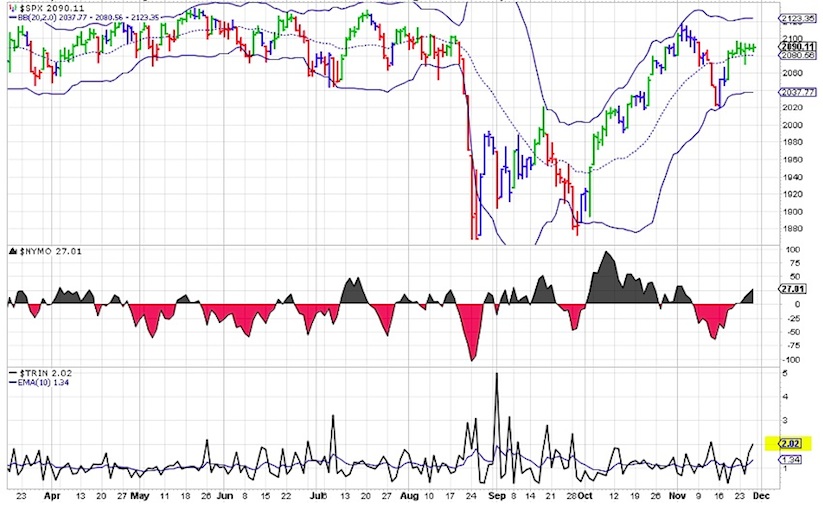
The bigger thing to watch out for is TRIN. Despite the shortened holiday week, it spiked over 2.00 and closed over that level at 2.02. Should this spike higher, there can be some pullback on the indices. Need to watch this combo closely.
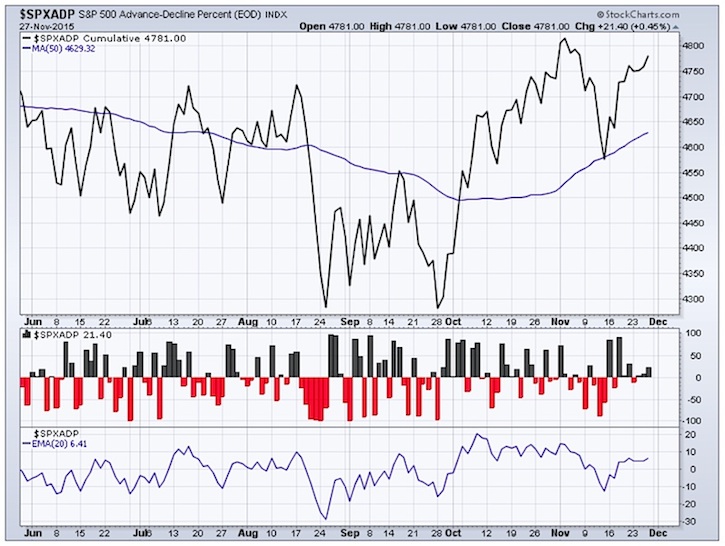
SPXADX – Advance-Decline Percent Data:
The Triple view of the Advance Decline data for $SPX. After a small consolidation, the S&P 500 Advance-Decline Percent continues higher and is not too far off from the recent highs. Some consolidation here will be good before an year end move higher.
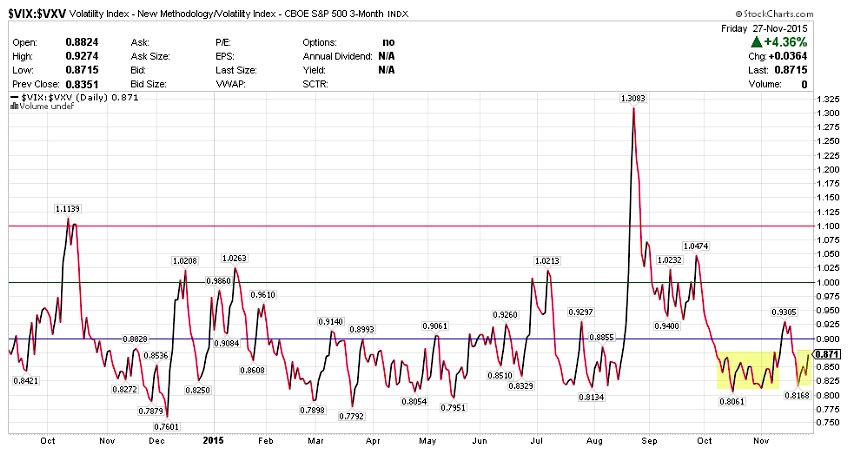
VIX:VXV Ratio – Volatility Term Structure:
VXV is the 3 month volatility index. The relationship between VXV and $VIX (30 day volatility) or the ratio between them if > 1.00 often spells trouble for equities. It bounced off of the 0.816 level. As long as this stays below 1.00, not much to worry here.
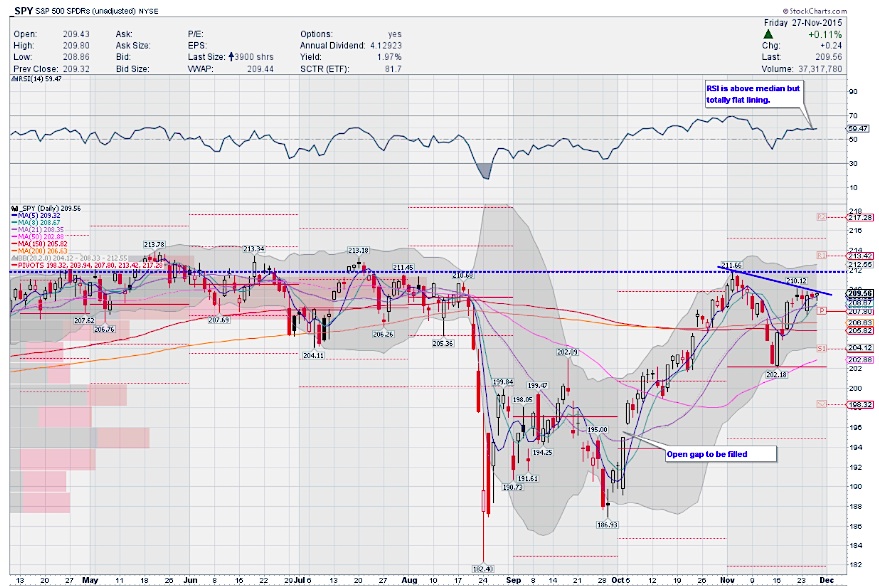
S&P 500 ETF (SPY) Daily Timeframe:
With the news about Russian jet being shot down, SPY gapped down lower at the open on Tuesday but buyers stepped in and closed the gap. The rest of the week saw pretty tight range trading in stocks. Overall a pretty flattish week for the stock market on low volume. The S&P 500 ETF (SPY) was unable to move past 210 entire week last week.
As far as momentum indicators go, RSI is flat just below 60 while MACD has not fully crossed up but is just touching the signal line. Slow STO is in the caution zone.
I really would like to see a higher high for SPY on this timeframe… to add to the higher lows that it has been sporting. If SPY can get above 210 first and it may retest 211.66. Note also that there is technical resistance around the 212.08-212.25 zone. While I am not expecting a push to All Time Highs for stocks this week, the above pointers will help the year end bullish thesis. Will the 5th time be the charm? It’s still very possible for a Santa rally to end the year.
You can read more of my weekly analysis on my website. Thanks for reading and have a great week.
Twitter: @sssvenky
The author has a position in S&P 500 related securities. Any opinions expressed herein are solely those of the author, and do not in any way represent the views or opinions of any other person or entity.


