By Andrew Kassen We’re ambivalent on stocks. That’s been the recurrent theme we’ve been reading and spinning out over the past few weeks; and this installment will prove no different. Self-avowed experts agree (and just about all of them, which raises the question of how there is the contrarian position) that such misgivings are driving the stock market higher.
Good news (bad news?), then, that the denouement of our long-tenuous thesis (elaborated more fully here) is nearly upon us? Now well into our S&P 500 1540-1580 target window with the wind gusts of a 10-consecutive up-day Dow Jones at our back and the S&P’s closing high (1565) and absolute swing high (1576) right in front of us, it is quite clear that the next several sessions are a time to closely observe broad-based price and momentum.
There are many considerations for the stock market here, so let me share a few:
1) Will breadth expand if the S&P 500 snaps to all-time highs (it hasn’t with the Dow surmounting and installing 8 sessions in-a-row in its own ATH territory) – or will it flag?
2) Will volume return or continue to taper away?
3) Will the S&P 500 overthrow its 2007 high to 1600 in a grind higher or can an eager market stage a blow-off?
Long-posed, these questions and others will soon be answered as the S&P now has the weight of proof on it to surmount, hold, and expand in the effulgent, untrodden lands over 1576.
Until the index is barefoot, spreading its toes out in the cool green grass fields of that mythical place – and especially then – we’ll continue our rule of principled skepticism, looking for reasons to doubt what the hardest evidence of all – price and its prevailing trend – are telling us.
Presently, S&P 500 (SPX) is at it’s latest Butterfly resistance (reversal?) window. Click the chart to enlarge.
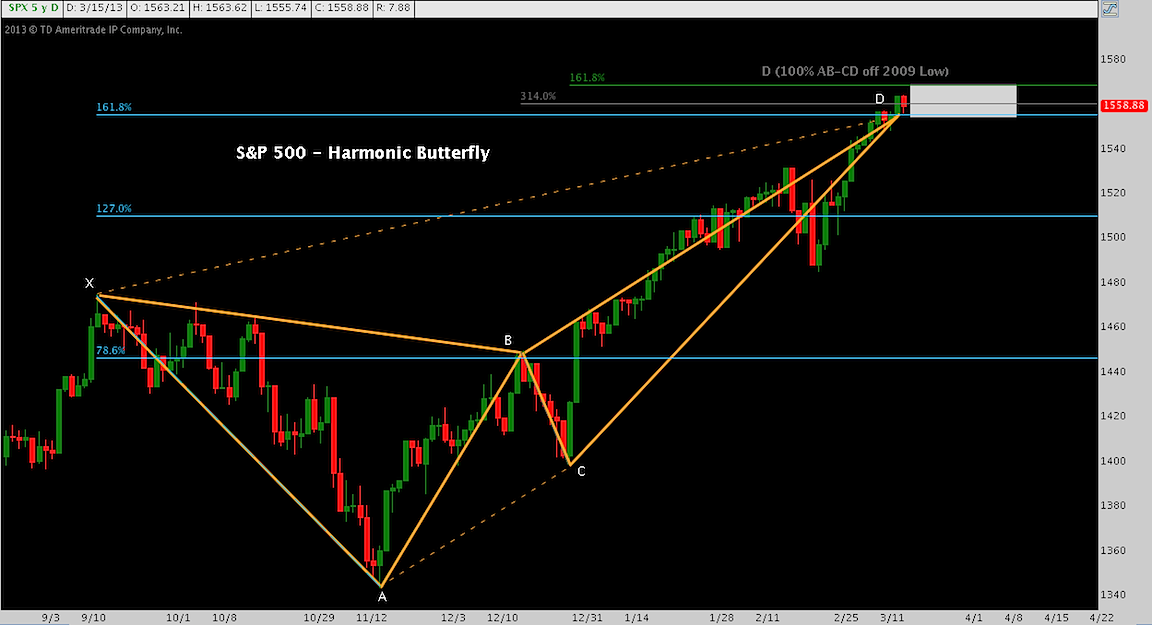
This chart may have a familiar ring to it.
Tops are processes, not punctiliar events or narrow points in time. Accordingly, we don’t pin possible inflection points on fine horizontal lines. Markets aren’t that efficient, the crowd that constitutes them made up of too much mass and beset by too much dissonance around the margins to stop on a dime and turn. One technical function of this, as displayed above, is how Fibonacci clusters cover a range as harmonic patterns reach their culminating point. Here, the range is 1550-1575.
Now for a step back: As we’ve seen before, this butterfly apex at point (D) has greater significance beyond the last 6 months. It is the tip of the spear in a major technical passage (20-month Rising Wedge) that will ultimately either push back or give the nod to a substantial move higher. Click the chart to enlarge.
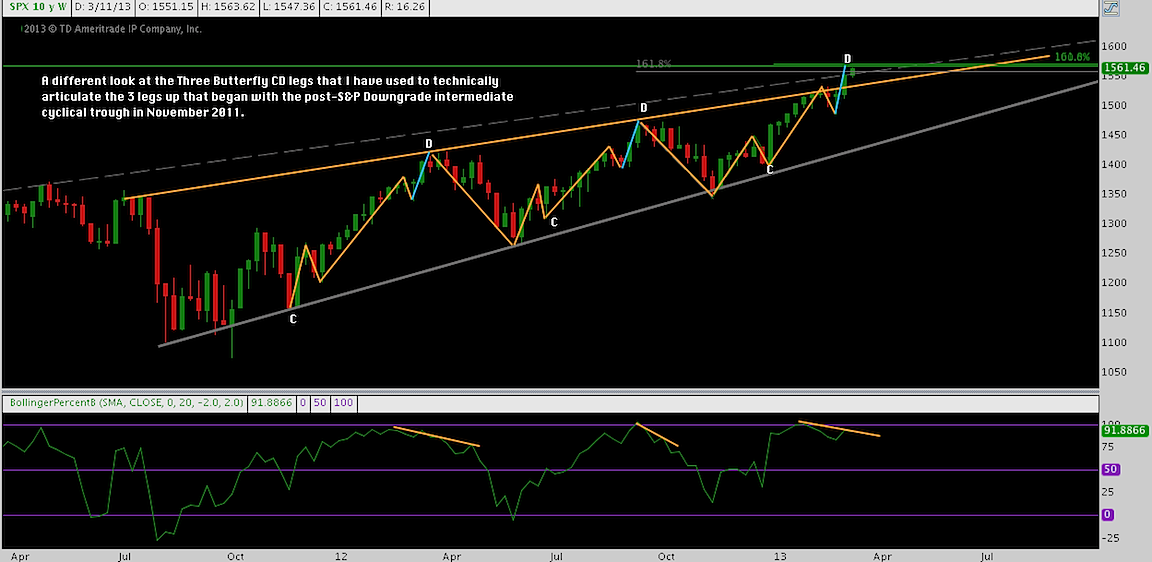
For the moment, it looks like “higher” might be the verdict: note the break higher over wedge resistance of the last two sessions. Yes, the 20-month-long wedge seems to be snapping up!
Now for the wet blanket: “Yes, the 20-month-long wedge seems to be snapping up!”
First, note the repetitive structure of each leg up inside the wedge (labeled CD because these are the terminal legs of the 3 intra-wedge butterflies). I’m not an avid Elliott Wave practitioner, but the 5-wave structure (and 3-wave structure of the interstitial corrections) practically jumps off the page.
Second, note the last leg of each of these waves (finishing at D, highlighted in blue). In each case, the angle of ascent is more acute than the measure of the up move it caps, even while momentum redlines (as demonstrated by the %B indicator plotted below, at the middle peak) and – in the first and present case – displays a negative divergence.
These are not stock market blowoffs: volume is tepid, to put it charitably. But in the previous two cases, this 5th leg/wave is an exhaustion period.
Third, the time symmetry here is unmistakable. In previous cases, this terminal leg occurred on the 03/05/12-03/19/12 candles, and again on the 09/03/12-09/17/12 candles, precisely 6 months apart.
And the current leg? Another six months further on, at the 02/25/13-03/11/13 candles.
This time may be different. The wedge is mature in duration, so a break here is not only reasonable; but we might be viewing the site of a secular break higher (in nominal terms).
Maybe. Observing a secular turn at this level of granularity is exciting; and could be inception of a very long, immensely profitable leg up for long trend stock market followers. That’s a dream-come-true for any long/short position trader or investor.
But through 1578-1580 – and allowing for a wedge overthrow to 1600 before turning lower, as some are entertaining – we remain suitably cautious. Were the current wedge break to fail (defined as a return back into the wedge construction), our caution would heighten. On the other hand: once above 1600, we will consider afresh whether internals are or aren’t underpinning the all-time high break and justifying resumption of a cyclical long bias.
Twitter: @andrewunknown and @seeitmarket
No position in any of the mentioned securities at the time of publication.
Any opinions expressed herein are solely those of the author, and do not in any way represent the views or opinions of any other person or entity.


