Key Stock Market Takeaways:
New highs are encouraging evidence of stock market strength, though ongoing divergences leave room for caution.
Rally participation has narrowed as the indexes have moved into record territory.
We continue to watch for evidence that the pattern in place since January 2018 has changed for the better.
Increasingly widespread optimism represents a near-term risk for stocks.
The S&P 500 and NASDAQ Composite moved into record territory this week. New highs can be a sign of strength, though in the current case we are looking for further confirmation that a sustainable new up-leg has emerged. The risk is that recent strength is primarily just a mirror of the preceding weakness and not yet evidence that a new up-trend has emerged.
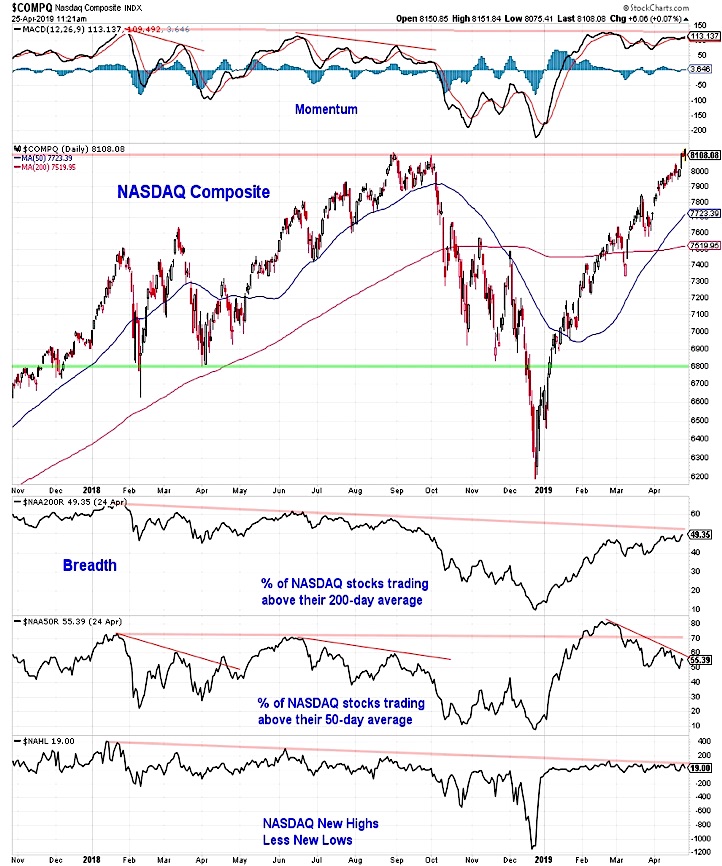
The NASDAQ Composite has completed a round-trip move from 8100 in August 2018 down to 6200 in December and back above 8100 this week. After some initially encouraging gains early in 2019, some of the breadth patterns that signaled the index was vulnerable even as it made new highs in the summer of 2018 have persisted. Neither the number of new highs less news lows nor the percentage of stocks trading above their 200-day averages has broken the downtrends that emerged in 2018. The percentage of stocks trading above their 50-day averages has slipped from above 80% to just 55% over the past two months, echoing the patterns seen in 2018.
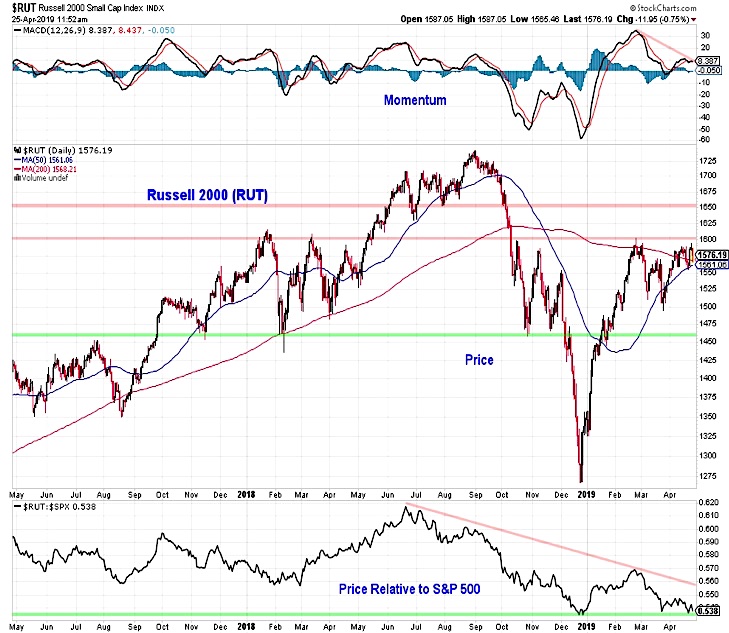
While the large-cap indexes have gotten to or at least near record highs (the Dow Industrials remain just shy of their October 2018 peak), small-caps have been a meaningful laggard. On a year-to-date basis, the Small-Cap Russell 2000 has matched the S&P 500 on a price return basis, though the Russell 2000 would need to rally nearly another 10% to get back to its August peak. After beginning 2019 with a burst of absolute and relative strength small-caps have struggled to rally since late February.
Momentum has cooled and relative to the S&P 500, the Russell 2000 has returned to its late-2018 lows. Renewed strength out of small-caps would help confirm the gains seen elsewhere. Getting above 1600 would seem to be an important first step in this process.
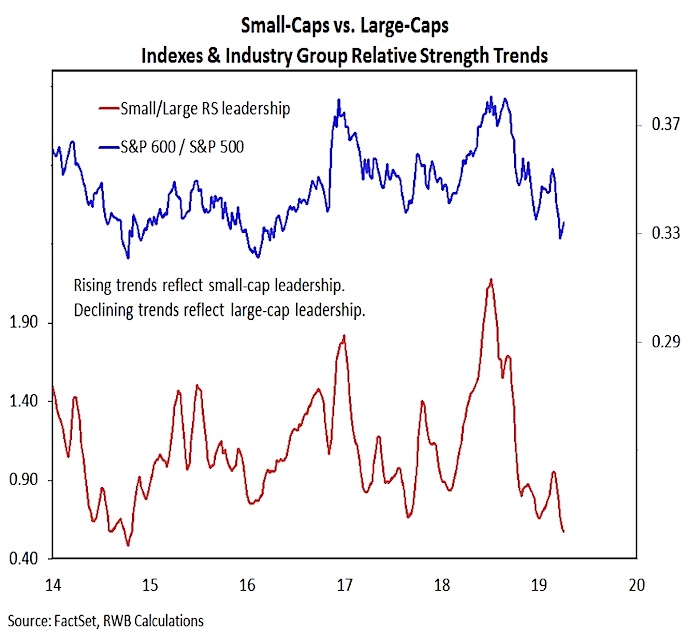
For evidence that small-caps are moving into a leadership position, we will watch not only the relative price movements between the small-cap indexes (Russell 2000 and S&P 600) and the S&P 500, but also our small-cap vs large-cap industry group relative strength trends.
Our weekly Market & Sector Trend Summary piece (published on Mondays) includes an industry group leadership heat map that breaks outs improving and deteriorating trends by industry group and size. The cumulative effect of these trends is that since mid-2018, small-caps have struggled mightily versus large-caps. Even the early-2019 gains were quickly reversed and the small/large industry group leadership trend is at its lowest level since 2014 and still falling.
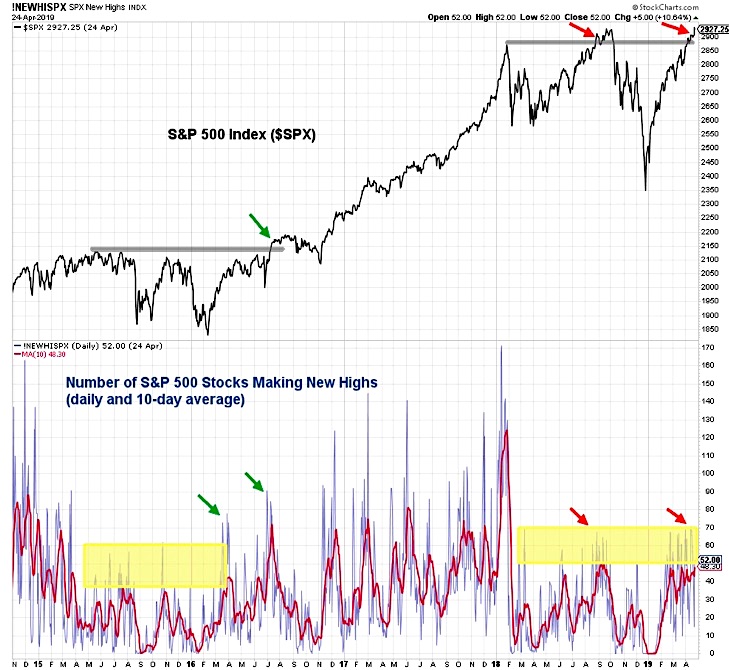
This week’s new highs on the S&P 500 have not come with a notable expansion in the number of stocks making new highs. In fact, on the day that the S&P 500 surpassed its 2018 peak, less than 1 in 10 S&P 500 stocks were making new 52-week highs. More important than an absolute numbers of stocks making new highs (though getting above 75 would be encouraging) is the pattern that has persisted.
Coming off of the early-2016 lows, the number of stocks making new highs expanded ahead of the move to a new high by the S&P 500. That was not the case as the S&P 500 move to new highs last summer, nor is it the case now. If rally participation begins to expand, current divergences could quickly dissipate, providing some fuel for the rally. So far, however, that has not been seen.
At the same time that rally participation has narrowed or (in the case of the new high list) not expanded, sentiment data has shown increasingly excessive optimism. The individual sentiment surveys show something of a mixed bag. The AAII survey has only 34% bulls, though bears (at 20%) are about has low has they have been in recent years. The II survey has bulls in the mid-50s, which is elevated though shy of the 2018 peaks, and bears below 20%.
The NAAIM exposure index has surged in April and 75% of the respondents in that survey have equity exposure of 90% or more. Aggregating this and other sentiment data, the NDR Trading Sentiment composite has recently moved back into the excessive optimism zone, an area in which stocks have struggled in the past.
Twitter: @WillieDelwiche
Any opinions expressed herein are solely those of the author, and do not in any way represent the views or opinions of any other person or entity.


 Ready To Break Out?")


