Last week, we covered the weekly charts on the “Economic Modern Family” (our favorite stock market ETFs) and why watching the one index and 5 sectors are best for spotting ahead of time, what comes next.
And for this week, we are extending this topic with:
- A fresh look at the Russell 2000, Retail, Transportation, Biotechnology, Semiconductors, Regional Banks, and including what we left out before we now add:
- Cryptocurrency-Bitcoin
- The Fed speak done for now and yields rising, where do we see potential cracks?
- Junk Bonds and yield spreads-what are they telling us?
- Commodities departing from the classic anchors: high yields and a strong dollar. What???
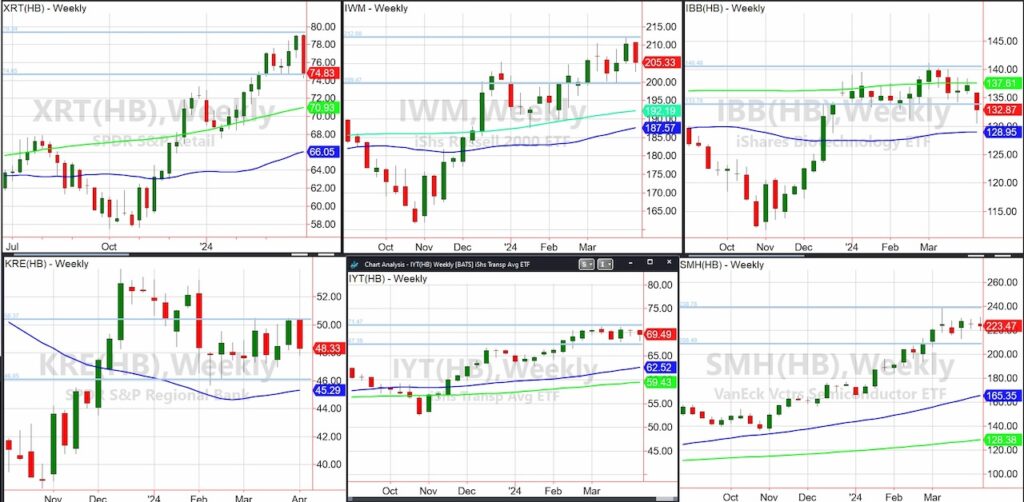
Looking at the 6 weekly charts, I updated the horizontal, parallel lines to show that at these higher levels, all the Family are rangebound when you study the patterns from late February to now.
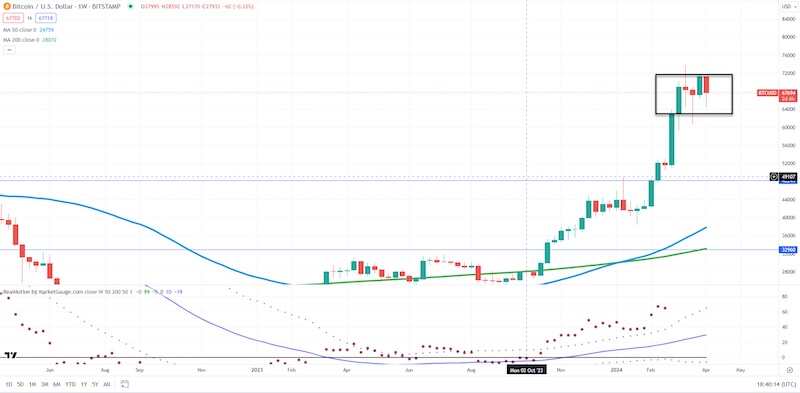
I also added Bitcoin weekly chart. The rectangle represents its recent trading range between 63,000 and 70,000.
Depending on how the consolidation levels break (up and down) it is easier to then trade by following the money.
As for the updated ranges:
The Russell 2000 (IWM) still has a range of 200-212.
The Semiconductors (SMH) consolidates between 220 and 240.
The Transportation sector (IYT) trades between 67-71. The tightest range in the Family.
Should that break out, consider it a good sign for the US economy and evidence of a “no” landing.
But IBB, XRT, and KRE are more concerning.
Biotechnology broke the recent trading range under 134.
The Retail sector (XRT) sits right on the bottom of the consolidation range at around 74.50.
And Regional Banks (KRE), while it is still above the bottom of the range, looks as if it convincingly rejected clearing the top of the range.
Adding this chart:
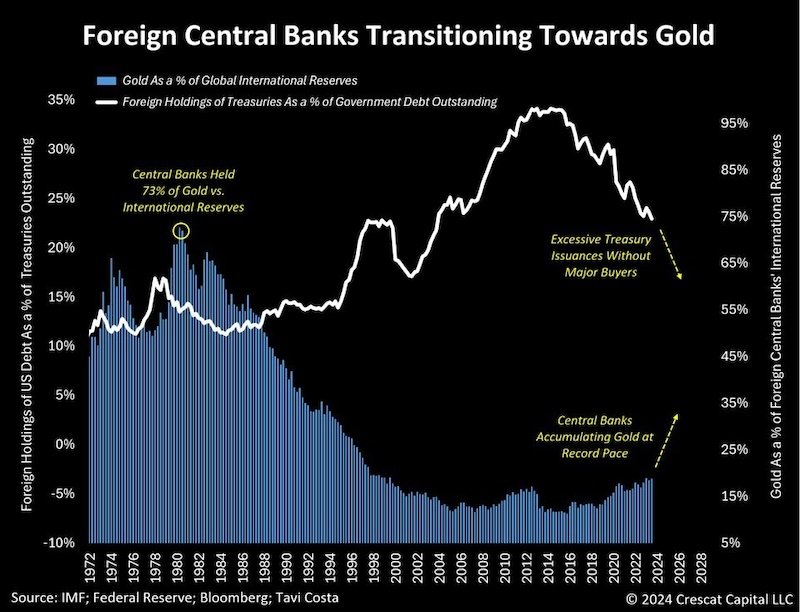
What we see is that foreign investments into gold have increased while foreign holding of US treasuries fall.
With gold making new highs in the face of higher yields and strong dollar, one must imagine why?
Then there’s this:
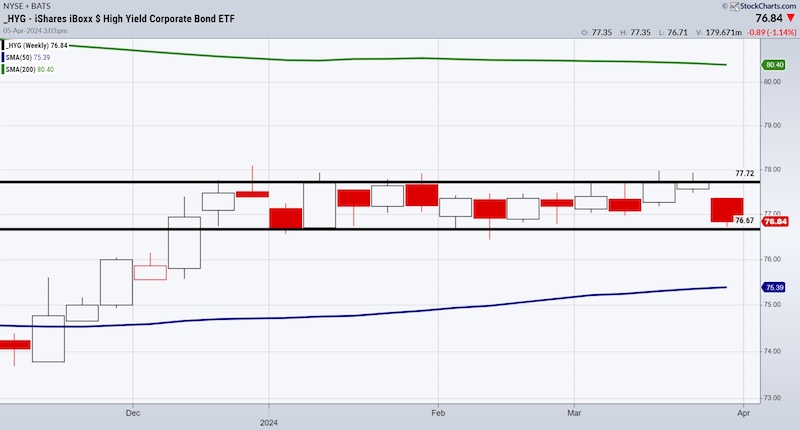
Rangebound junk bonds HYG weekly chart also shows us that under 76.50 risk begins to show more risk off.
Of course, over 77.72, the picture looks much better.
In the last week, high yields credit spreads between 3-7 years bonds and junk bonds widened out, but not in any major way at this time.
However, should that spread widen further, along with what we are seeing it in Regional Banks, Retail, and the underperformance of the small caps, it could suggest stress in the credit markets.
That would also explain the move in gold.
Regardless, consolidation is one of our favorite chart patterns, especially when prices are consolidating at new highs or lows.
The direction the price follows, up or down out of the consolidation can lead to explosive moves.
Twitter: @marketminute
The author may have a position in mentioned securities at the time of publication. Any opinions expressed herein are solely those of the author and do not represent the views or opinions of any other person or entity.

: Worrisome to Broader Market?")


