Do high market valuations matter to stock market performance? My thought on this: They don’t matter until they matter!
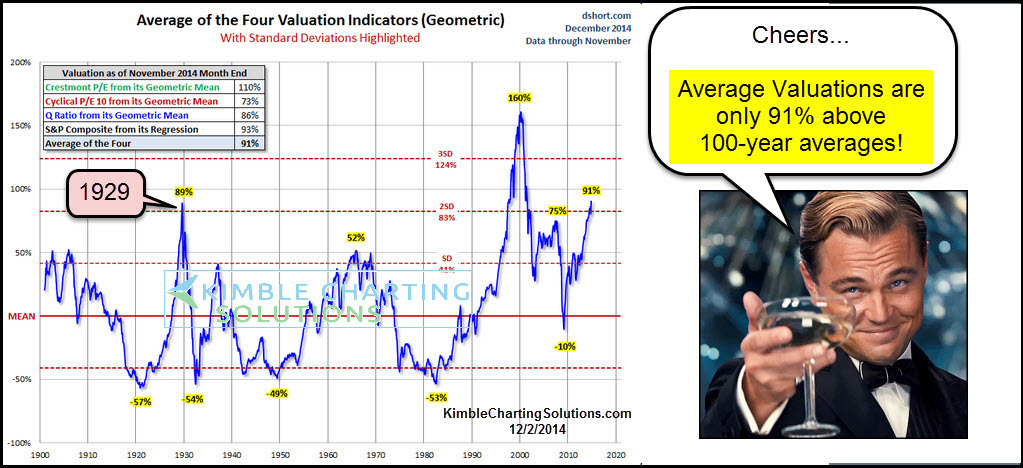
My good friend, Doug Short of Advisor Perspectives, just released his “average valuation” chart above. This chart highlights four different valuation measuring tools and then averages the four of them together.
As you can see, the average stock market valuations have now surpassed levels reached back in 1929 and have only been higher one other time in history, which was in the late 1990’s.
How many long lasting bull markets in the past 200 years have started from these valuation levels? None so far! Does this mean the current upward trend in the stock market has to stop now? No!!! But it’s a variable that we must keep in mind as we manage risk.
The Russell 2000 (RUT) & Mid-Cap 400 (MID) find themselves at a price point where resistance could become a little heavy. See chart below.
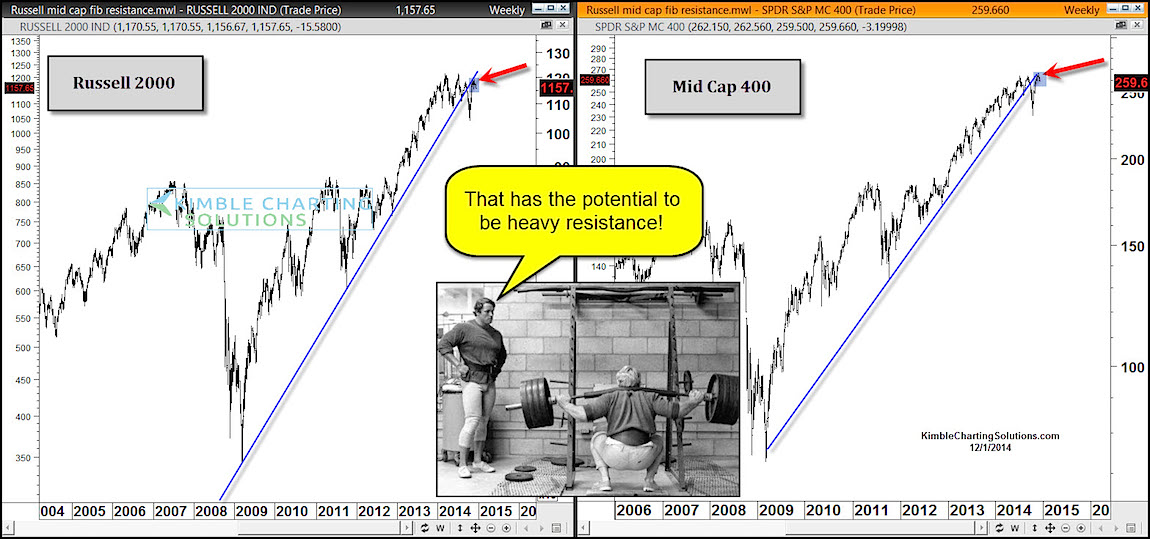
This chart reflects that both of these indexes are kissing the underside of resistance at the red arrows. Valuations by themselves don’t stop strong upward trends.
When stock market valuations are high, it can pay to look for price patterns where peaks can take place. Note that a break above resistance by both of these indexes, would be a bullish event.
Investors might want to pay close attention to the Russell & Mid-Caps in the near future, as what happens here could well impact the S&P 500 (SPX – Quote) and other stock markets around the world. Thanks for reading.
Follow Chris on Twitter: @KimbleCharting
No position in any of the mentioned securities at the time of publication. Any opinions expressed herein are solely those of the author, and do not in any way represent the views or opinions of any other person or entity.


