The market buzz can be quite contagious.
“Market didn’t collapse on the bank news-must be bullish.”
“Yellen will save the day buy making sure depositors are safe.”
Yellen herself- “We have an economy that is performing very well.”
And of course, we all know that tomorrow is the big FOMC day – .25% to a pause on the table.
Meanwhile, far away but not SO far away, we have the bromance between Putin and Xi.
And they are creating their own contagious sentiments.
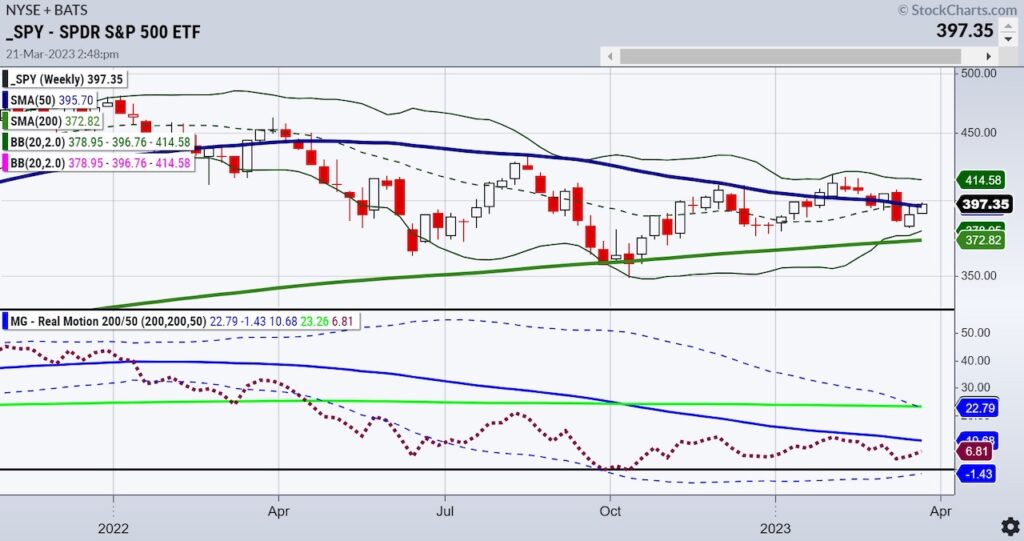
Looking at the S&P 500 chart on a weekly timeframe, SPY needs a weekly close over the blue line or the 50-week moving average at 395-396.
That would put the index in a bullish phase.
Even then, the hurdles of the persistent trading range using the 23-month moving average remains.
Furthermore, the Real Motion indicator shows us that the SPY has not cleared the blue line (50-WMA) since January 2022.
Momentum is HUGE here and worth watching.
As our everybody’s favorite index along with some choice names-NASDAQ.
But back to our burgeoning bromance.
Making some headlines of their own, such as:
“Russia-China Joint Statement: We are seriously concerned about U.S. Military Biological Activities Carried Out on Their Territory and Abroad,”
“China has shipped more than $12 million in drones to Russia since it invaded Ukraine”, per NYT.
“In the year since Russia invaded Ukraine, roiling energy markets across the globe, China’s appetite for Moscow’s oil, gas and coal has grown apace, with imports rising by more than half.”
“Russia says it’s close to reaching its pledged 500,000 b/d oil production cut-Moscow adds that it will sustain the output cut until July.”
“China is giving a handful of its most successful chip companies easier access to subsidies and more control over state-backed research, as tightening US controls on access to advanced technology force a major rethink in Beijing’s approach to supporting the sector.”
Can this amount to much?
Yes.
Will it?
I have yet to change my mind about chaos and a potential Supercycle in commodities.
And I am far from alone.
“Goldman Sachs expects a commodities Supercycle driven by China and the capital flight from energy markets and investment this month after concerns triggered by the banking sector. As losses mounted, it spilled into commodities.”
As always, price pays most. Open mindedness pays the big bucks and opportunities are always there.
Risk/reward matters most.
Stock Market ETFs Trading Analysis & Summary:
S&P 500 (SPY) 400 key resistance now
Russell 2000 (IWM) 170-180 range now
Dow (DIA) Still has work to do-324 the 200-DMA to hold
Nasdaq (QQQ) 328 is the 23-month MA resistance and now a bit overbought on the indicators
Regional banks (KRE) 44 support 50 resistance
Semiconductors (SMH) New high then retreat-no confirmed reversal though yet
Transportation (IYT) Holding the 200-WMA but has to clear the 200-DMA at 224
Biotechnology (IBB) Over 127.50 impressive
Retail (XRT) 60 big support and 64 big resistance
Twitter: @marketminute
The author may have a position in mentioned securities at the time of publication. Any opinions expressed herein are solely those of the author and do not represent the views or opinions of any other person or entity.


