THE BIG PICTURE
The major stock market indexes are in strong uptrends. Although we are overdue for a pullback, the best thing for traders to do is follow the price action and avoid getting caught up in the noise and anticipating the next move. If/When we enter a market pullback, your process should stop you out of the trade… or offer new looks on both sides (long & short).
Without further adieu, here’s my weekly futures trading update and outlook. We’ll start by taking a look at the S&P 500 (INDEXSP:.INX).
S&P 500 Futures (ES) – Week 41 (week of October 9)
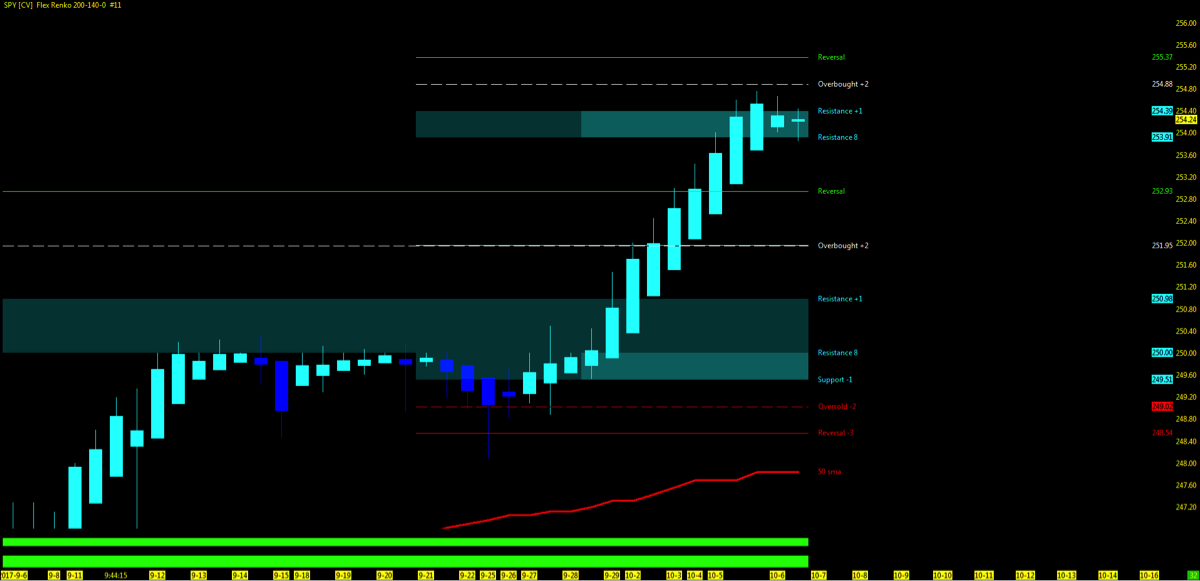
Technical Trends…
- Check out my week 40 recap and trend charts
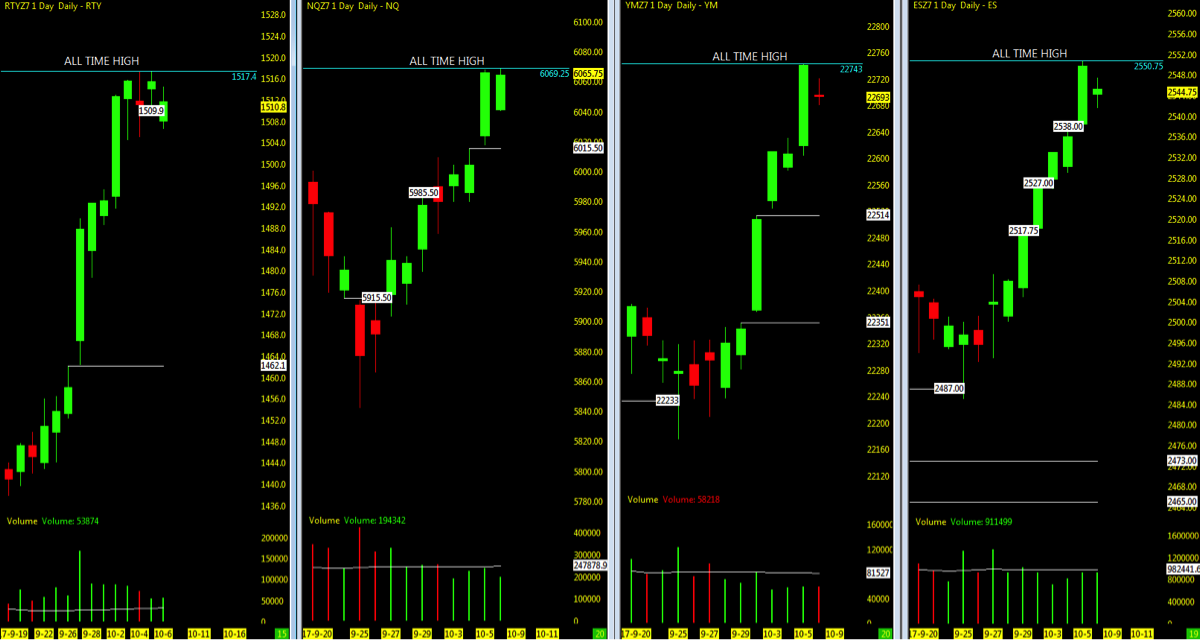
- Stock market momentum (on several indices) closes above weekly open and near all time highs
- The Dow Jones Industrials (INDEXDJX:.DJI) leads the drive higher as the Russell 2000 (INDEXRUSSELL:RUT) consolidates and NQ plays catch up
- The VIX Volatility Index (INDEXCBOE:VIX) is holding in mid 9’s.
- AMZN back above 50ma, FANG aka FAAMG now FAAANG (Adobe, AVGO)
- All eyes on short interest build up and upcoming earnings report
- Current IBD Outlook: Confirmed Uptrend on FFTY
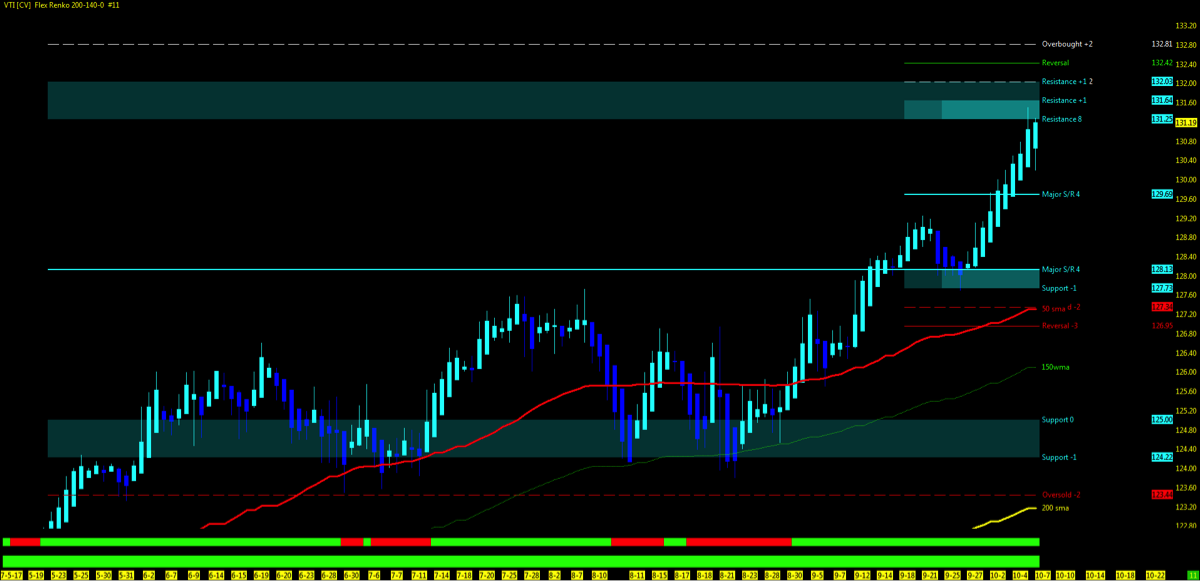
- VTI – Total Stock market Index seen below remains in an uptrend at MML highs.
Key Events in the Market This Week
- USA: Banks closed Monday, FOMC minutes, Earnings, CPI, Retails Sales
- GLOBAL: Merchandise balance
- Q4 Earnings Season
- Dominoes, Blackrock
- Financial earnings Thursday/Friday
- US army annual conference
- Retail Sales report out Friday
- OPEC monthly report
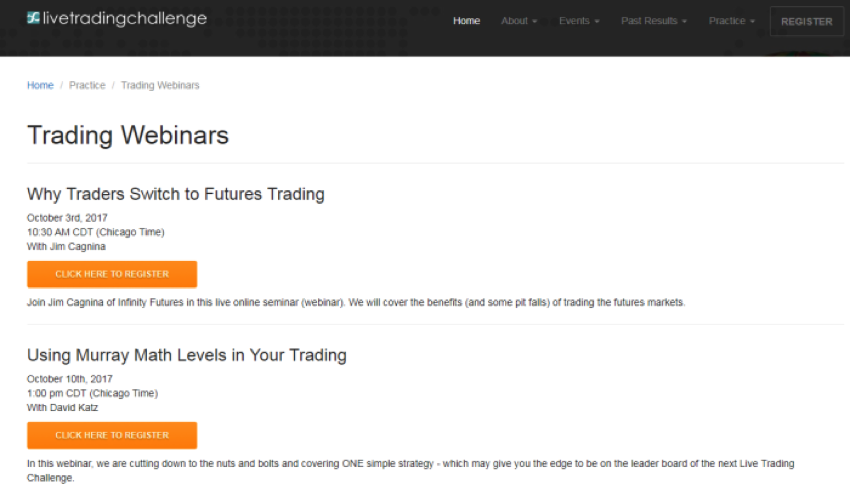
Murray Math Levels Webinar
THE BOTTOM LINE
Technical Momentum probability on the stock market indices remains in an UPTREND at MML highs.
October permabears REMAIN and are hoping for a pullback as Earnings Season begins to roll out. Watch for the FANG/FAAMG/FAAANG stocks pullback to play out the Nasdaq futures and Tech ETF momentum. Dollar index pullback holding upside – no indication of resuming downtrend (break under UUP 24.22 and close will be first indicator)
As always, watch for MML setups on price action break above resistance high and back under resistance low. Downside, watch for open gaps to be closed and 50% pullback as 1st level of support.
LOWEST OPEN GAPS
- S&P 500 (ES): 1589
- Nasdaq (NQ): 3864.75
- Russell 2000 (RTY): 1462.1
- Dow Jones Industrials (YM): 14745
Attempting to determine which way a market will go on any given day is merely a guess in which some will get it right and some will get it wrong. Being prepared in either direction intraday for the strongest probable trend is by plotting your longer term charts and utilizing an indicator of choice on the lower time frame to identify the setup and remaining in the trade that much longer. Any chart posted here is merely a snapshot of current technical momentum and not indicative of where price may lead forward.
Thanks for reading and remember to always use a stop at/around key technical trend levels.
Twitter: @TradingFibz
The author trades futures intraday and may have a position in the mentioned securities at the time of publication. Any opinions expressed herein are solely those of the author, and do not in any way represent the views or opinions of any other person or entity.

: Creating Bullish Divergence?")

: Creating Bullish Divergence?")


