Today’s daily stock market update contains two videos by Mish from the studios of StockCharts.com.
The first video is Mish’s Daily Five.
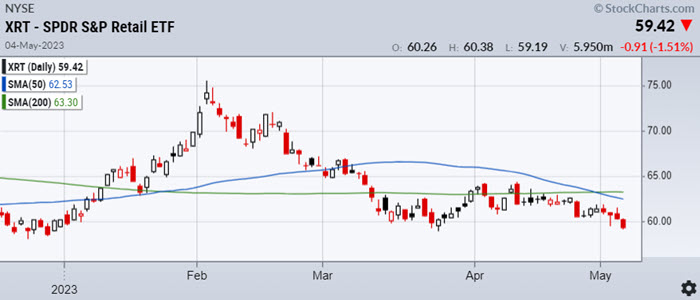
In this video Mish explains why Grandma Retail (XRT), may become our new leading indicator.
In addition, Mish reviews how to trade the current conditions in not five but six retail stocks.
The second video is Mish on StockCharts’ Final Bar with David Keller.
In this interview they discuss why Mish believes that yields will peak in May, what to expect next in gold, and more!
Stock Market ETFs Trading Analysis & Summary
S&P 500 (SPY) 23-month MA 420
Russell 2000 (IWM) 170 support – 180 resistance
Dow (DIA) Over the 23-month MA-only index
Nasdaq (QQQ) 329 the 23-month MA
Regional banks (KRE) 43 now pivotal resistance
Semiconductors (SMH) 246 the 23-month MA
Transportation (IYT) 202-240 biggest range to watch
Biotechnology (IBB) 121-135 range to watch from monthly charts
Retail (XRT) 56-75 trading range to break one way or another
Twitter: @marketminute
The author may have a position in mentioned securities at the time of publication. Any opinions expressed herein are solely those of the author and do not represent the views or opinions of any other person or entity.

: Worrisome to Broader Market?")
