Equity Markets did today pretty much exactly what they have been doing since early October, reversing big moves, especially on the opening.
So here is the current winning formula …. if there is a big gap or vicious intraday move, fade it.
So today, after some nasty downside action for equities in the overnight market the key US indexes gapped up over 1% which, by the end of the day pretty much evaporated into the either. The Dow, the S&P 500, and the IWM all closed pretty where they finished yesterday.
The one exception was the Nasdaq 100 (QQQ) which did end up reasonably in the green or up +.45%. However, many previous leaders that drove the NASDQ 100 to new highs in September are now at or near the bottom of list such as Nvidia (NASDAQ: NVDA), Apple (NASDAQ: AAPL), Netflix (NASDAQ: NFLX) and Facebook (NASDAQ: FB).
NVDA, is down 50% since October and Facebook over 30% since late July.
Another exception to the general malaise is TSLA which is now the leading stock in the NASDQ 100, despite all the controversy surrounding its CEO.
Count us as fans especially if it can close above 385. Above that level, TSLA could run up almost as fast as its new sports car which will do 250 MPH and 0-60 in 1.9 seconds.
Looking at the Modern Family the evidence is mounting that with all members in a bear phase there is a lot more downside coming.
In fact, the Russell 2000 (IWM) is the weakest US equity index and hit new lows for the year.
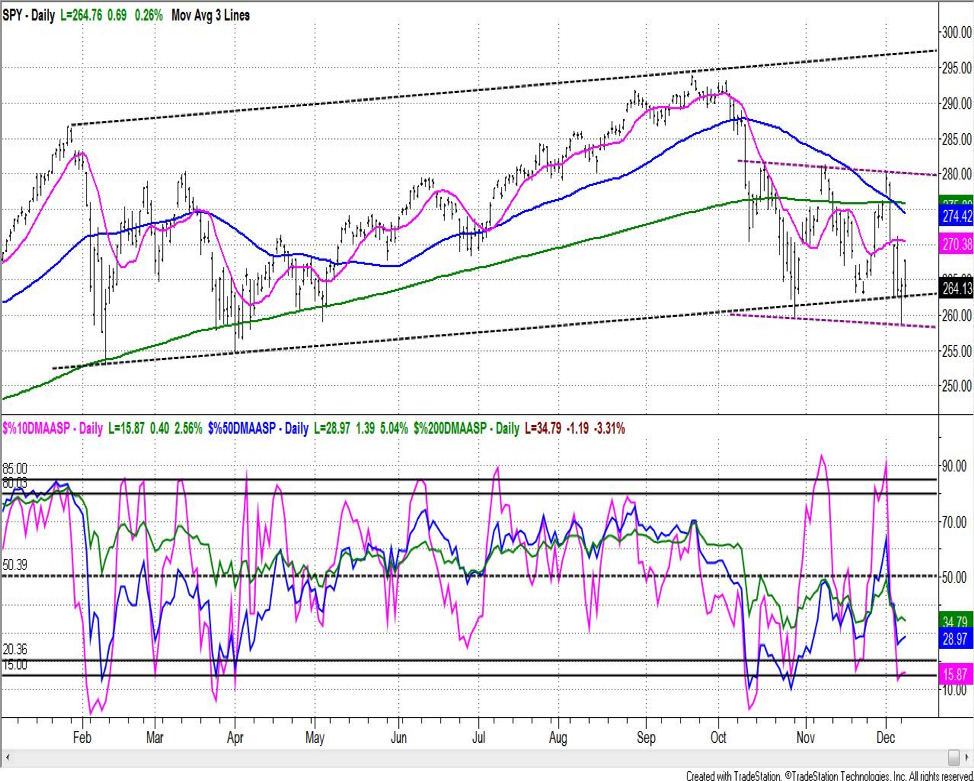
However, there is some opportunity for the upside, there are two very clearly defined trading channels for the S&P 500 which has held this week and one key market indicator is oversold as seen in the chart above.
Therefore, there is a decent shot at a technical bounce/year-end rally from current levels and maybe it develops into something more if the geo political scene shifts.
Thanks for listening as Mish is a tough act to follow
Trading levels for stock market ETFs:
S&P 500 (SPY) – 270.40 is the number this must clear to improve outlook. The 2018 low is 252.92 made in February.
Russell 2000 (IWM) – 150 the big resistance-and this key index of the US economy made and closed on new low on the year
Dow Jones Industrials (DIA) – 233.20 is important support and the 2018 low made in April. And close under 240.50 would make that more likely. 251is the looming overhead resistance
Nasdaq (QQQ) – Still needs to clear back over 166.50 and remains in bear phase
KRE (Regional Banks) – This sector made new YTD low today & touched levels not seen since mid-2017. The 200-week moving average is at 50.12 just below today close and need to hold or look for much more downside
SMH (Semiconductors) – 86.95recent low is key support on weekly charts and a break of this level could trigger a waterfall decline
IYT (Transportation) – New low close for the year and poor relative strength. Nice to see if this can hold above 176.62 and clear 180
IBB (Biotechnology) – 104.75-105 resistance with 100-101 major support. Currently only member of modern family with positive volume patterns and relative strength
XRT (Retail) – 42.40 is support and the 200-weekly ma. 47 is big resistance area and would need to clear this on good volume to get bullish.
The author may hold a position in mentioned securities at the time of publication. Any opinions expressed herein are solely those of the author, and do not in any way represent the views or opinions of any other person or entity.


