Last Friday we noted how several major stock market index and sector ETFs (QQQ, IWM, JNK, SMH) bounced off the 50-day moving average.
Now with the market still undecided, we can build a plan on what to look for if we break under the 50-day moving average.
Let’s take a look at the Nasdaq 100 ETF (QQQ) and the S&P 500 ETF (SPY) on a daily chart below.
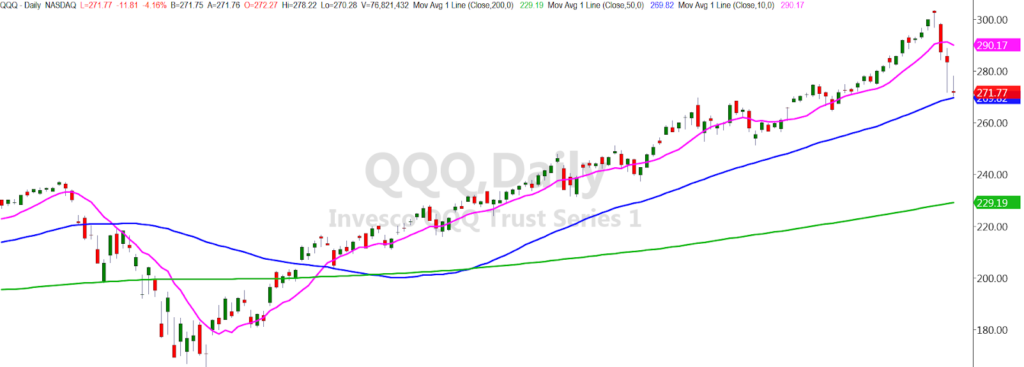
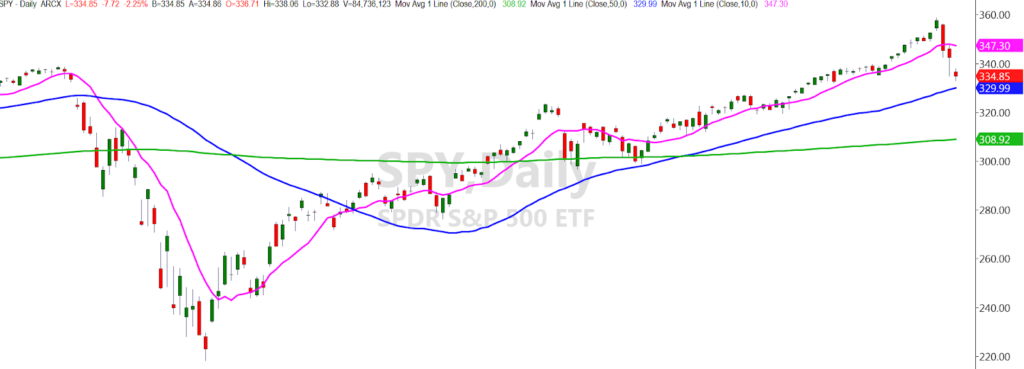
Here we can see that while the QQQs have settled down almost perfectly on the 50, the SPY has a little more to go.
With a break of the 50 we then would look for a second day to close under the 50-DMA.
This is very important because the second day is confirming a caution phase change. Many times a moving average is broken, but the security closes higher the next day.
If both symbols break and confirm this makes a stronger case for the continuation down.
You might then think “Well great! Now we see prices confirming a breakdown, where might the price go next?”
Ahh I’m glad you asked. If we have convincing closes under the 50 bringing us further away from the 50-DMA the next point of interest would be 260 for the QQQS and 323 for the SPY.
These prices are right at the 17-Week Exponential moving average for both symbols.
This leaves the QQQs in a prior consolidation area, and the SPY in a prior consolidation area with support from June’s highs.
We can never be 100% sure what the market will do but looking for past support areas and key indicators can help us prepare immensely!
S&P 500 (SPY) 329 support
Russell 2000 (IWM) Broke 50-DMA watching for a continue
Dow Jones Industrial Average (DIA) 271 support
Nasdaq (QQQ) Sitting on 269 50-DMA. Watching for break lower.
KRE (Regional Banks) Also sitting on 50-DMA
SMH (Semiconductors) Next support 159
IYT (Transportation) Watching for a break back over the 10 DMA with resistance at 203
IBB (Biotechnology) Watching for support at 124
XRT (Retail) Next support at 50-DMA 48.00.
Volatility Index (VXX) Broke 50 and 200-DMA. Watching for continue
Junk Bonds (JNK) New Sitting on 50-DMA. Watching
LQD (iShs iBoxx High yield Bonds) 134.56 next support
GLD (Gold Trust) Held 180 support. A close over the 10-DMA would be nice.
GDX (Gold Miners) Holding onto the 50-DMA. Can it get back over?
SLV (Silver) 23.00 support and watching
USO (US Oil Fund) Large break-down with news of price cuts.
UNG (Natural Gas) Did not clear 14 and broke-down.
TLT (iShares 20+ Year Treasuries) Watching to stay above 10-DMA
USD (Dollar) 10-DMA resistance Closed under 50-DMA watching for confirm.
VNM (Vietnam) Held the 10-DMA
JO (Coffee) Still looks good
CANE (Sugar) Ended the day green. Watching to clear MAs
Soybeans (SOYB) Closed higher
DBA (Agriculture) Needs to continue higher passing the Mas.
Twitter: @marketminute
The author may have a position in the mentioned securities at the time of publication. Any opinions expressed herein are solely those of the author, and do not in any way represent the views or opinions of any other person or entity.

 Rolling Over At Key Fibonacci Level?")


