Today was the first time that the S&P 500 ETF (SPY) opened lower than the prior day’s low since July 24th. The same is true for the Nasdaq 100 ETF (QQQ).
The Russell 2000 ETF (IWM) did it just last week, but not since July 7th prior to that.
The significance of this pattern is twofold:
- It can provide measure of the bulls’ confidence.
2. It can also give you a quick way to identify stocks that may be worth buying on the market’s lower open day, and provide you with a great intra-day stop.
First let’s look at the measure of the bulls confidence. Today we saw the SPY and IWM open significantly below their prior day low and their 10 DMA.
The reaction to the weakness was to buy, not sell. The bulls are confident.
So when the bulls are confident, which stocks should you buy?
The QQQ, opened only marginally lower. This is the first clue that if the market rallies that day, the QQQ names will probably lead.
And lead they did.
The “lower open” was treated like a buy signal by many of the big cap tech names. More interesting are the name that kept going up beyond the prior day’s high and have now have interesting breakout patterns.
Here is a short list of some big cap stocks that lead the markets higher and have interesting breakout potential right now: AMZN, MSFT, ADBE, MA, FB, NOW.
I’m sure there are more.
Take a look at how each of them opened, and you’ll notice that all but AMZN didn’t open below their prior day low.
This is pattern isn’t a buy signal on it own, but if you have stocks you like and you’re looking to buy the market’s lower open, sometimes lower is not actually what you want.
As an added bonus for looking at the market this way, you can put your stop below the low the prior day, which in this case, has demonstrated to be significant support.
I gave you the stocks above because they may be timely for OR reversals or continuations tomorrow.
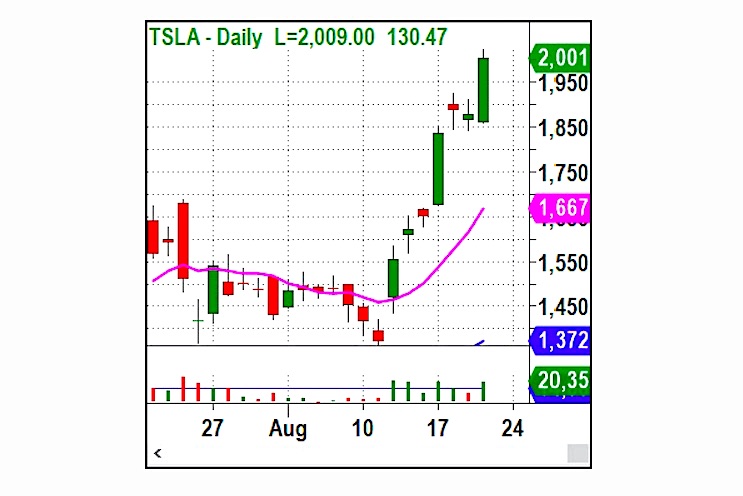
But this idea of having strong stocks on your list to apply this idea and OR breakout to wouldn’t be complete if I didn’t suggest you look at this same pattern on AAPL and TSLA today.
Keep it simple.
Note: PDL = Prior day low, PDH = Prior day high
S&P 500 (SPY) All-time high resistance at 339 area. Watch 335 as important support.
Russell 2000 (IWM) Closed under 10 DMA. Key level to break above is 158, then 160 is resistance area. Sitting on the 10 DMA. 153 is key support lower.
Dow (DIA) Close on 10 DMA. Today’s low is pivotal support
Nasdaq (QQQ) New high. 275 is pivotal area. 260 is key support level and a trendline.
TLT (iShares 20+ Year Treasuries) Siting right below 10 and 50 DMA. Resistance area is at 166. 163 next big support.
Twitter: @marketminute
The author may have a position in the mentioned securities at the time of publication. Any opinions expressed herein are solely those of the author, and do not in any way represent the views or opinions of any other person or entity.

: Cup (and Maybe Handle) Watch")
 Trading Near Top Of Price Range")

