$SPX S&P 500 Index – Daily Timeframe:
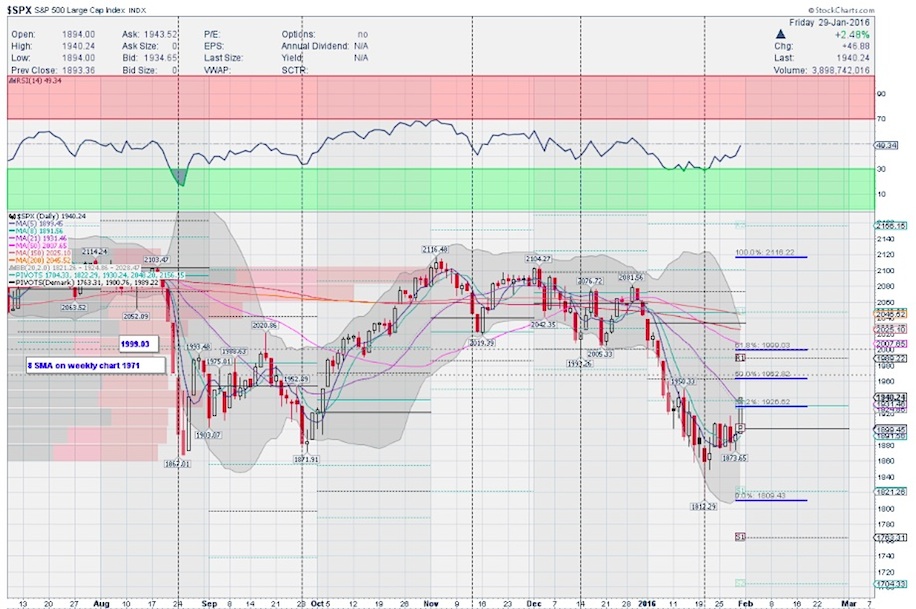
Here’s the updated chart of S&P 500 ($SPX) that I had posted in Stocktwits and Twitter over the weekend. Price has closed over 38.2% retracement and 21 SMA on the Daily chart. Some pullback has occurred this week.
A retest of the the breakout zone near 1910-1905 zone was expected, but we dipped a bit deeper. Either way, we need to rally now for another healthy leg higher if there is one towards the 50% fibonacci retrace or even the 21 SMA on weekly chart (1963-1971). While many may look for a pause around here, I will just say that these are the immediate levels that I am looking for but with a chance of a run towards 61.8% retrace. A move over 1963-1973 zone might bring in some inflows though. As long as the 1890 area holds, there should be another leg higher for stocks. Nothing goes straight up or down, so expect some back and forth filling with some volatile moves.
From a momentum indicator standpoint, none of them indicate any overbought conditions on this timeframe. RSI is nicely rising and is right at median. MACD has made a bullish cross and trying to move higher while Slow STO is rising into bullish zone.
All the moving averages above price are sloping lower, so curb your emotions on guessing (or hoping). The stock market has a lot to prove here still. Follow the price action, resistance, support and pivots with Fibonacci levels – will make things easier for you.
Thanks for reading and have a great rest of your week.
Twitter: @sssvenky
The author has a position in S&P 500 related securities. Any opinions expressed herein are solely those of the author, and do not in any way represent the views or opinions of any other person or entity.

: Showing Some Signs of Emerging Strength")
