THE BIG PICTURE
The S&P 500 had been rallying up a vertical wall since the start of 2018… until last week. Now we are in the reality of a stock market correction (whether brief or intermediate term).
Traders need to follow the price action (and indicators) and steer clear of the noise and opinions. If the market correction continues, your process should offer you new looks on both the long & short side of trades.
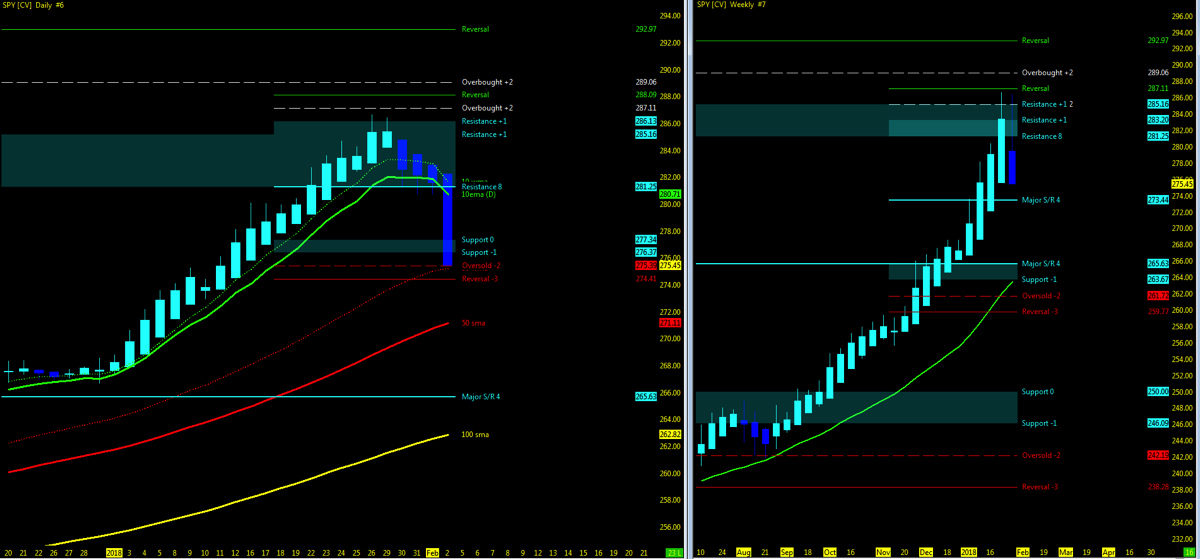
Below is my weekly stock market futures trading update and trend outlook. Let’s start by looking at a chart of the S&P 500 ETF (SPY).
S&P 500 Chart – Before The Pullback
S&P 500 Chart – After The Pullback
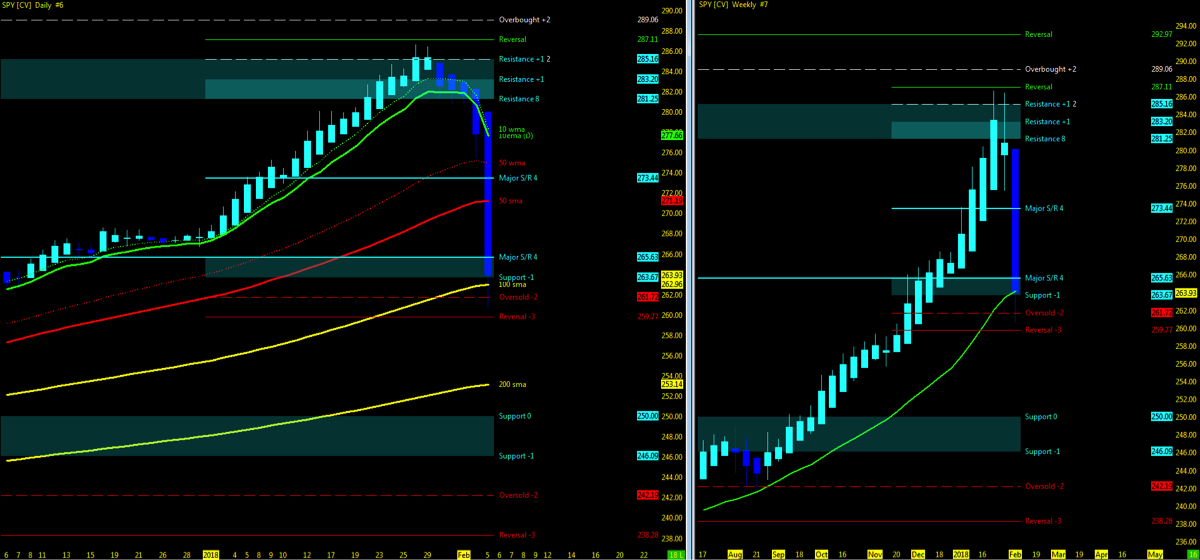
Using the Murray Math Level (MML) charts on higher time frames can be a useful market internal tool as price action moves among fractal levels from hourly to weekly charts. Confluence of levels may be levels of support/resistance or opportunities for a breakout move. Optimal setups will pass through Resistance or Support prior to moving in the opposite trend.
Technical Trends…
- Week 05 recap and trend charts
- Stock market indices PULLBACK below short-term 10ma
- Open Gaps upside; closing in on downside levels
- VIX Volatility levels rising.
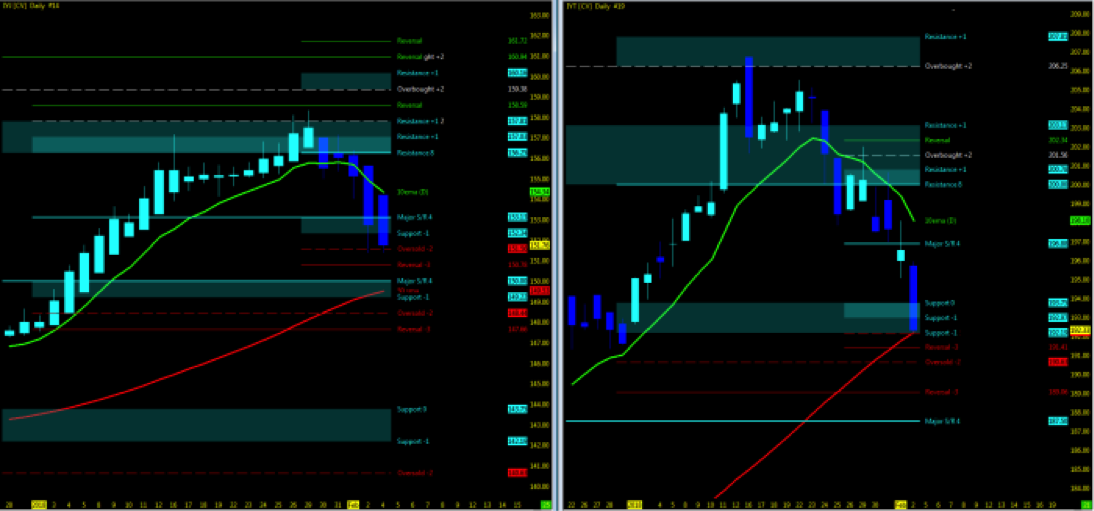
- Dow Jones Industrial/Transports
- Transport’s holding pullback; Industrial’s pullback = IN SYNC
- Monitor for the two ETF indices to remain in sync upside as supporting indicator of uptrend momentum
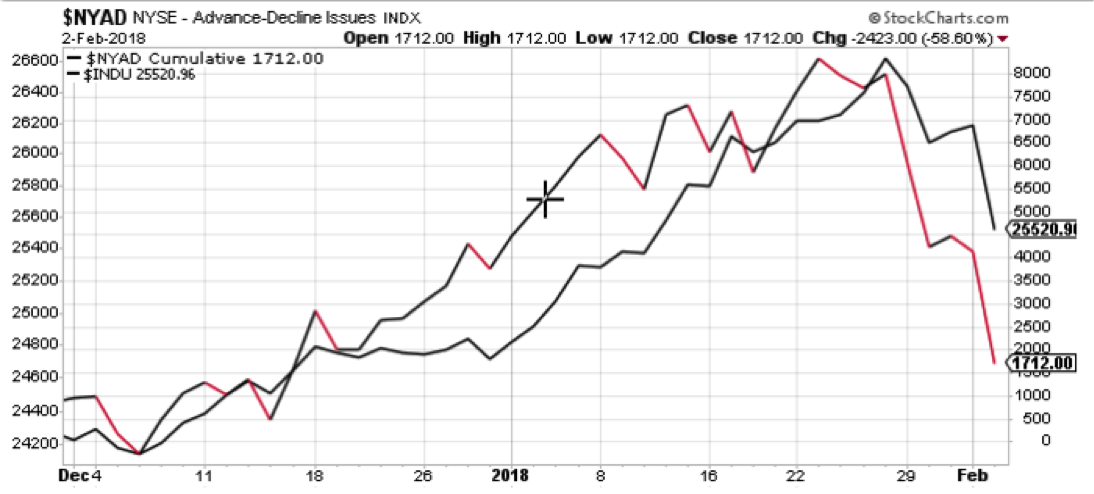
- NYAD (NYSE Advance – Decliners)/INDU in sync downside
Key Events in the Market This Week
- USA: Earnings, Jolt’s
- GLOBAL: China: CPI
- Q4 earnings:
- TSLA, GRUB, DIS, TWTR
- Chipmakers
- Video Games
The Bottom Line
Uptrend Technical Probability
- Indices PULLBACK at all time highs – go higher (IBD motto)
- VIX Volatility Index still relatively low
- UUP – Dollar index momentum BIG PIC downside with downside MML targets – STALLS
- FDN (Tech ETF) WEEKLY strong uptrend – earnings remain positive
- VTI momentum strong upside on Weekly; still above 10ma
- Bloomberg Commodity index (BCOM) index has surged by nearly 6% since mid-December (@KennyPolacari)
- $DJP Weekly remains strong uptrend
Downtrend Technical Probability – CONFIRMED
- Key moving averages in sync on indices crosses 10ma; closing in on 50ma
- Downside Open Gaps pushing further away
- NYAD/INDU momentum upside
- Price action pushing at MML high resistance on both long and short term levels
- IYJ/IYT PULLBACK in sync downside below 10ema; IYT leads
- UUP – Dollar index momentum BIG PIC downside at support – poised for a pullback upside
- FFTY pullback to 100ma
- Many weekly charts point to a top (strong bearish engulfing pattern). (@EDUCOFIN)
- Bloomberg Commodity Index (BCOM) majority of 18 sectors under baseline
My 3 Cents
As I mentioned last week, overall indices/general market trend still remained upside with the good possibility that week 05 could offer us a correction. The persistent question forward is, was that enough for the market right now, or is more deep selling to follow? Daily pics have broken the 10ma’s and are closing in on the 50. Surely I will monitor for the 100 and 200 as well. Any return back above the 10ma will keep the trend upside.
Until then, watch for earnings to play out the remainder of the month. With the break below the 10ma and a close below the MML resistance low, is a good opportunity to enter on the swing short. For the intraday, always being ready in both directions. Long term holders, an opportunity to move your stop closer or simply just wait to re-balance in the next quarter. Either way, momentum surely has slowed down and offered an opportunity to the short side but I’m not ready to call this a deeper sell off. A healthy and much needed correction for now and keeping a watchful eye on support levels and moving averages.
Technical TREND Update on Market Pullback
…24 hours later and markets clearly have followed through on a market correction. Watching levels downside include key levels on the MML’s as well as the moving averages. Most important is to keep in mind the volatility that exists on a lower time frame and best to move to the higher time frame and eliminate much of the noise. In the big picture of trend, market isn’t pulling back to give up all the gains yet of 2017. Watch for key moving averages for support and as I have looked at for weeks with some inkling that when the market was ready it would pull back. So here we are. Don’t go shouting out that the sky is falling and 2007/08 is here again. That is some of the fear that will play out including algorithmic programs ducking out with one another. Long term holders, watch your stops and look for opportunities to rebalance portfolios at lower prices. Swing traders have been given the gift of volatility but be careful – stick to the higher time frames and hopefully a contract runner will be on your charts. Technically, this is exactly what we thought would play out, it was just a matter of time. Watch those open gaps. They will be closed. You always have the option to sit out and wait till the storm (VIX) calms and get back to consistent trading, not the dreams and lure of volatile market drops.
Attempting to determine which way a market will go on any given day is merely a guess in which some will get it right and some will get it wrong. Being prepared in either direction intraday for the strongest probable trend is by plotting your longer term charts and utilizing an indicator of choice on the lower time frame to identify the setup and remaining in the trade that much longer. Any chart posted here is merely a snapshot of current technical momentum and not indicative of where price may lead forward.
Thanks for reading and remember to always use a stop at/around key technical trend levels.
Twitter: @TradingFibz
The author trades futures intraday and may have a position in the mentioned securities at the time of publication. Any opinions expressed herein are solely those of the author, and do not in any way represent the views or opinions of any other person or entity.


