The Big Picture
Investors are operating in a climate that is prone to reversals and quick moves so we must remain focused on managing our trades within our given trading timeframes.
There is still a lot of “noise” out there as bulls vs bears continue to state (and re-state) their case. As traders, it is wise to follow the price action (and trend indicators) and steer clear of noise and opinions.
Below is my weekly trading update and stock market trends outlook. Let’s start by looking at chart of the major stock market indices, including S&P 500 ETF (SPY).
Current Technical Trends For Week 19 (week of May 7)
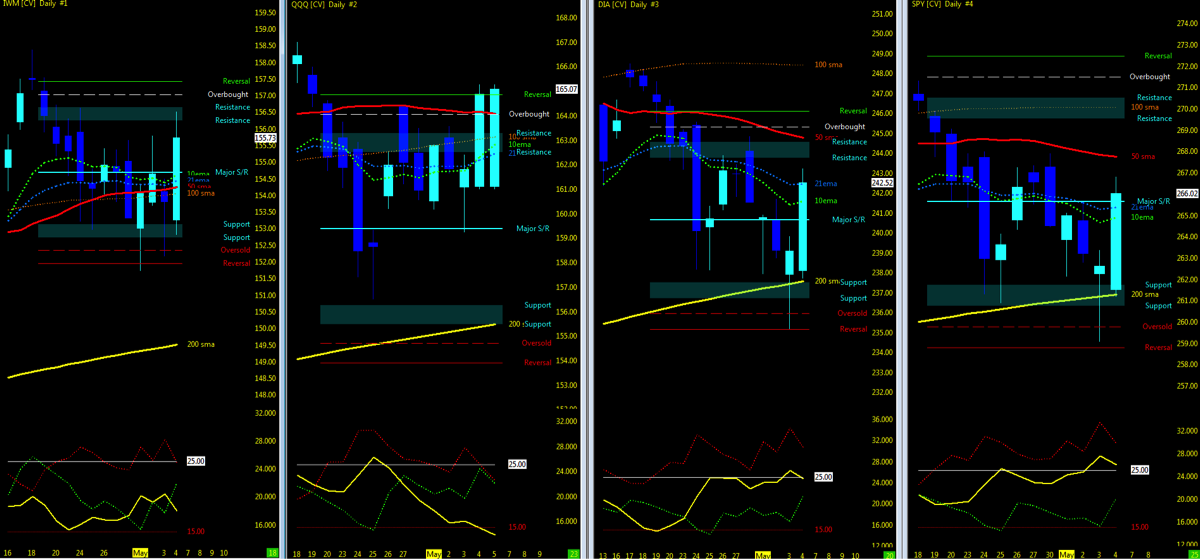
- Indices ADX momentum down; moving averages out of sync, consolidation ensues.
Attempting to determine which way a market will go on any given day is merely a guess in which some will get it right and some will get it wrong. Being prepared in either direction intraday for the strongest probable trend is by plotting your longer term charts and utilizing an indicator of choice on the lower time frame to identify the setup and remaining in the trade that much longer. Any chart posted here is merely a snapshot of current technical momentum and not indicative of where price may lead forward.
- Check out my Week 18 recap and trend charts
- Daily VXX (VIX Volatility) momentum FLAT
- Weekly uptrend momentum pullback
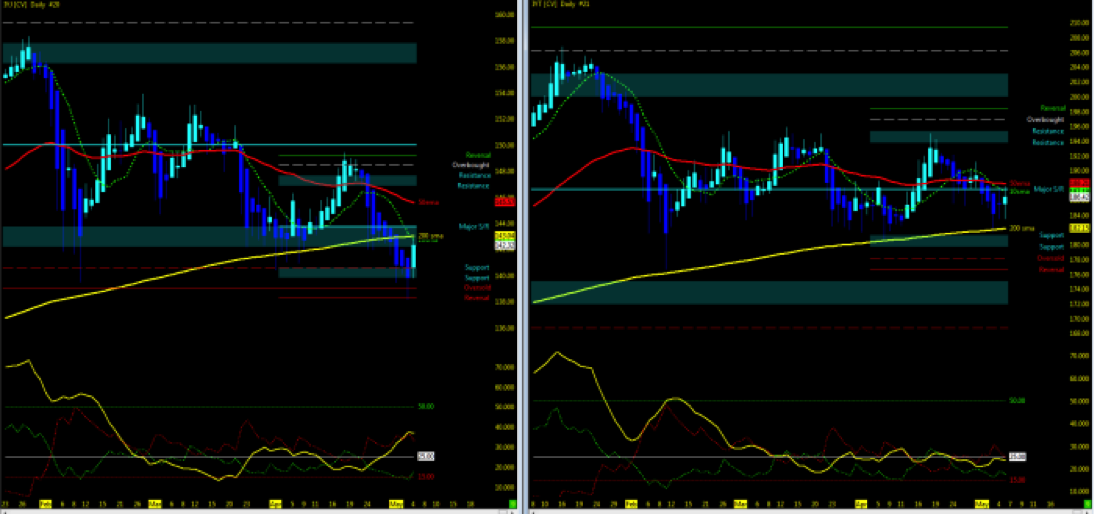
- Industrials/Transports
- Monitor for the two ETF indices to remain in sync as supporting indicator of momentum (Up or Down)
- Momentum down /ADX down
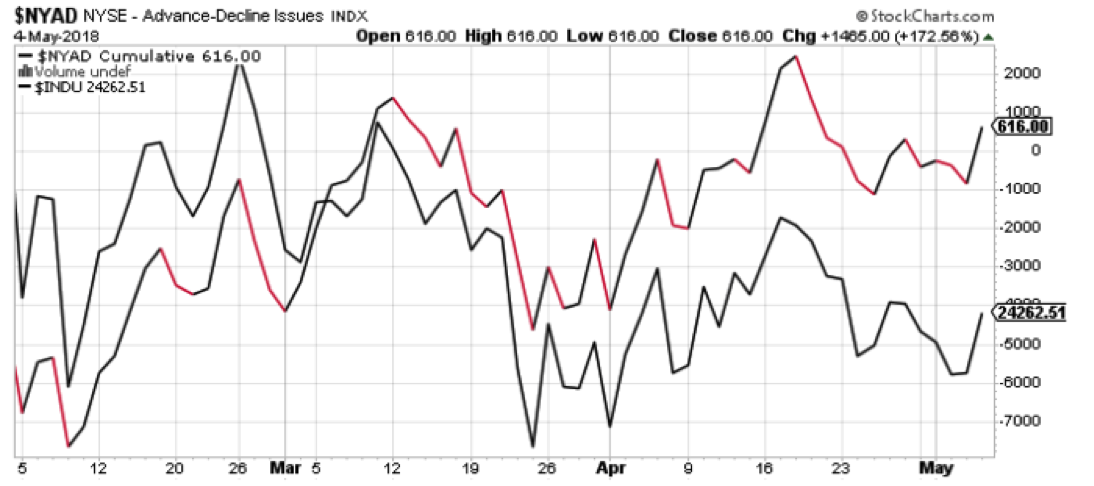
- NYSE Advance-Decline Line in sync with Dow Jones Industrials
The Bottom Line
Finishing off week 18 on the NFP report to give a little push in the market unfortunately on lower volume. ADX momentum continues to drawn down though flat to the naked eye. Moving averages continue to be out of sync where preferred to see price action above or below the 10, 50 and 200 in Trend, we continue to be congested, consolidated and range bound. not an electric year for 2018 so far. The 200ma remains top be the last stronghold as market price action continues to hold the line.
Technically, the momentum remains unchanged as price action will either break to the upside and regain synchronous traction on the moving averages to take us higher, or we retest the 200ma once again and drop further. Watch for the daily ADX to cross to indicate direction of short term trend and confirmation of price breaking back above the 50ma with the 10ma trailing. If the market is unable to regain the traction, weakness will prevail and probability will take us down further. Tough call in congestion. 50% get it right, the other half missed the mark.
For the intraday trader, both directions offer opportunity. Swing traders, be ready for major earnings to move the market and respond at the 50ma. Long term, sit quietly and wait to re-balance at lower price at the end of Q3.
The Big Picture Market Pulse: Consolidation remains at the key moving averages (10/50ema) as they are out of sync with slight edge to the downside. ADX momentum downside FLAT on Indices as VIX volatility trending downside.
Thanks for reading and remember to always use a stop at/around key technical trend levels.
Twitter: @TradingFibz
The author trades futures intraday and may have a position in the mentioned securities at the time of publication. Any opinions expressed herein are solely those of the author, and do not in any way represent the views or opinions of any other person or entity.


