THE BIG PICTURE
Investors are operating in a volatile stock market climate for the first time in many months. Stay disciplined and stick to your timeframes. The market is nearing another decision point.
There is plenty of “noise” due to market cross-currents. Traders need to follow the price action (and indicators) and steer clear of noise and opinions. If the market correction continues, your process (and stops and limits) should offer you new looks on both the long & short side of trades.
Below is my weekly stock market futures trading update and trend outlook. Let’s start by looking at a chart of the S&P 500 ETF (SPY).
S&P 500 Chart – Week 7 (week of February 19)
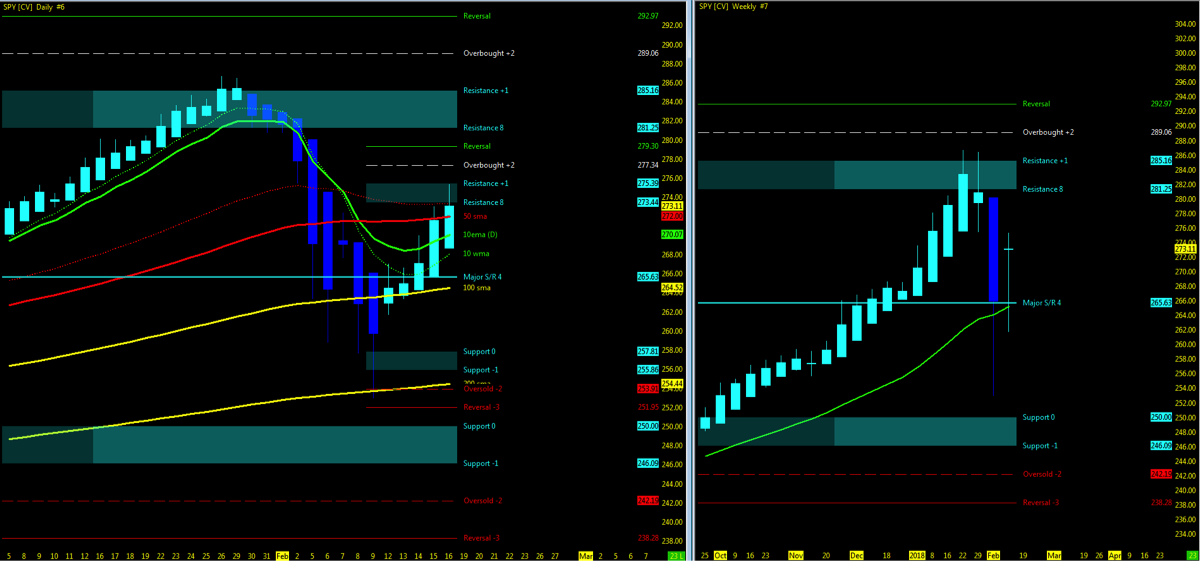
Using the Murray Math Level (MML) charts on higher time frames can be a useful market internal tool as price action moves among fractal levels from hourly to weekly charts. Confluence of levels may be levels of support/resistance or opportunities for a breakout move. Optimal setups will pass through Resistance or Support prior to moving in the opposite trend.
Technical Trends…
- Week 07 recap and trend charts
- The major stock market indices hold upside off 200ma bounce
- Open Gaps above/below; none formed in week 7
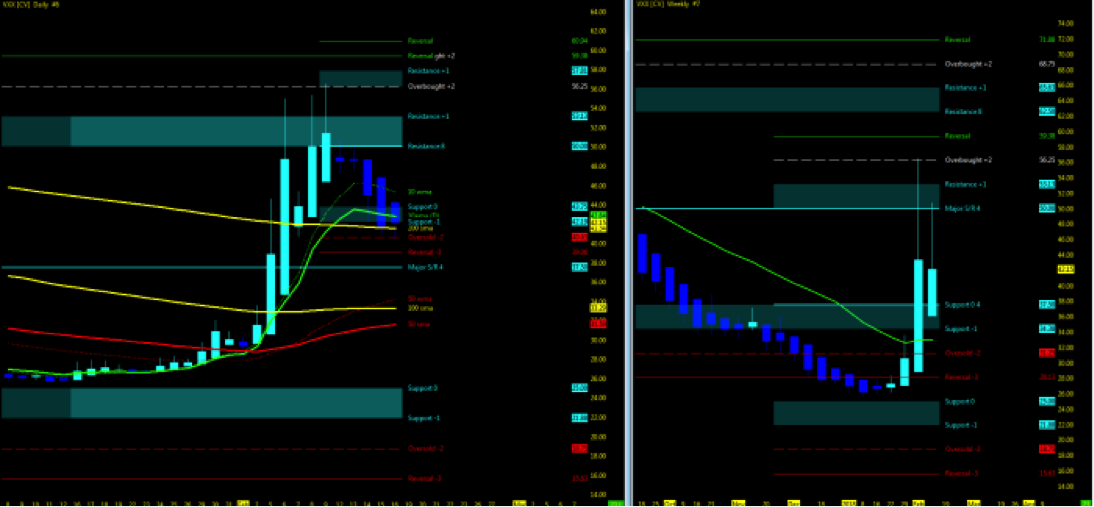
- VIX Volatility levels decrease to high 19’s
- Dow Jones Industrials / Dow Jones Transports
- Dow Transports; Dow Industrials pullback, 10 MA’s under 50 = IN SYNC
- Monitor for the two ETF indices to remain in sync as supporting indicator of momentum
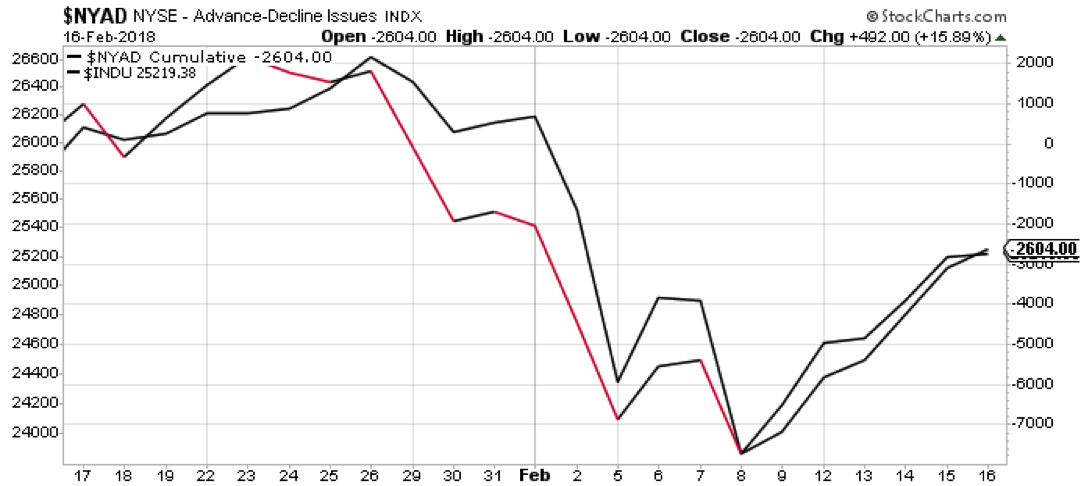
- NYAD (NYSE Advance – Decline Line) in sync with Dow Jones Industrials
Video Outlook (Markets Covered: ES, YM, NQ, GC, CL)
Key Events in the Market This Week
- USA: Earnings, FOMC minutes, Housing, Fed Speakers
- GLOBAL: GB: GDP; JP,CA: CPI
- Q4 corporate earnings:
- WMT, HD, FSLR
- Oil/Gas Sector
- Grocers Sector
- Restaurant Sector
The Bottom Line
Uptrend Technical Probability
- Stock indices bounced off 200ma’s and maintain uptrend
- UUP – Dollar index momentum BIG PIC remains downside
- VTI/FFTY support off MML lows
- VXX (VIX ETF) momentum downside; 50 under 200sma
- NYAD/INDU momentum upside
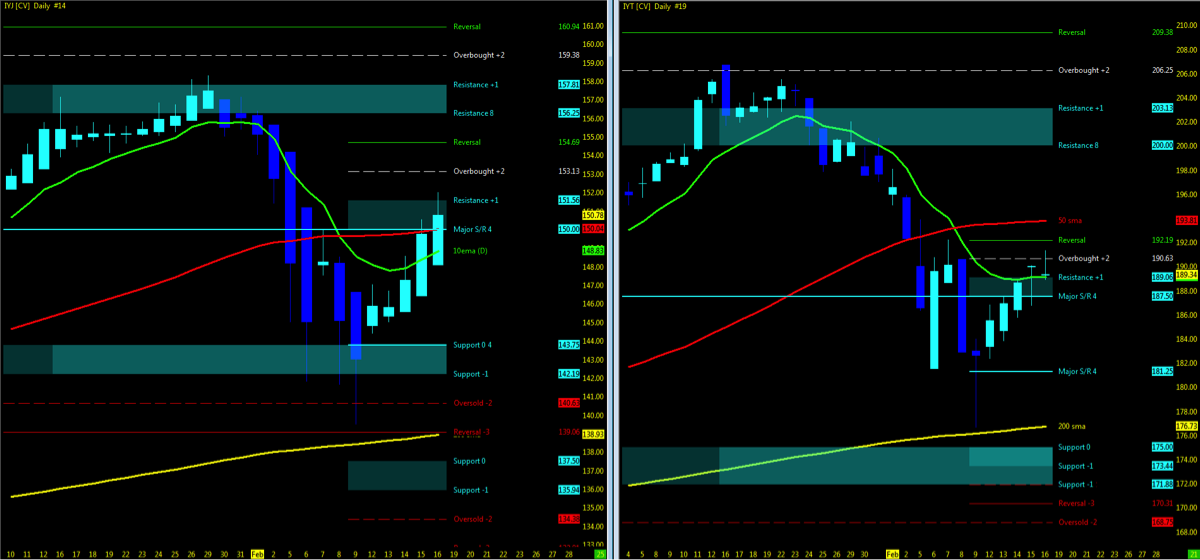
- IYJ/IYT pullback in UPTREND
- FDN (Tech ETF) WEEKLY strong uptrend – earnings remain positive, Moving averages 10>50>200
Downtrend Technical Probability
- Key moving averages out of sync; price action except NQ under 50ma
- VXX (VIX ETF) pullback to daily 200ma; support?
- VIX in “20 zone”
- Downside Open Gaps remain open to be closed
My 3 Cents
…Week seven will be a decision week to monitor for the institutional support at the 200ma and MML support levels. Indecision means just as much probability to the downside and upside from a technical perspective at this juncture but then again, I’m sure there are those that are adamantly calling for more downside and just as many waving their return to the high flags.
You caught my post last week, correct? As stated above, indecision turned into momentum holding above the 200ma with the NQ/FDN/QQQ leading the rush back upside. Surely the swing trader paid well in week 07 and the intraday position benefited from both directions. The long term holder sitting patiently till the end of Q2 for lower prices. So where does that leave us heading into week 08 for the short term perspective?
Monitoring the VXX big pic downtrend at the 200 sma short term uptrend pullback, technical probability may lean to more downside as the HA bars trending down on the reversal at the MML resistance. Lower VIX would play out to higher indices price action. Decision time.
What still concerns this Jedi Trader is that moving averages remain out of sync and until the 10ma pushes back above the 50 with price action above, momentum remains merely at this point in a pullback. A one week pullback at this point is not enough to confirm a return to the highs as the 50ma is the next road block ahead into week 8 as price action settles in week 07 at the line.
As long as earnings continue to hold up at least on the NQ, this is perhaps just what the market needed at this juncture, a good ALGO selloff and pullback upside.
My own three cent wish remain the same. More downside for the long term till Q2 close.
Watch for MML setups on price action break above resistance high and back under resistance low for first signs of a pullback. Downside, watch for open gaps to be closed and 50% pullback as 1st level of support.
Attempting to determine which way a market will go on any given day is merely a guess in which some will get it right and some will get it wrong. Being prepared in either direction intraday for the strongest probable trend is by plotting your longer term charts and utilizing an indicator of choice on the lower time frame to identify the setup and remaining in the trade that much longer. Any chart posted here is merely a snapshot of current technical momentum and not indicative of where price may lead forward.
Thanks for reading and remember to always use a stop at/around key technical trend levels.
Twitter: @TradingFibz
The author trades futures intraday and may have a position in the mentioned securities at the time of publication. Any opinions expressed herein are solely those of the author, and do not in any way represent the views or opinions of any other person or entity.


