THE BIG PICTURE
Investors are operating in a volatile stock market climate for the first time in many months. And the reality of a stock market correction (whether brief or intermediate term) is setting in.
The markets are set to rally for a second day in a row, and there is plenty of “noise” due to market cross-currents. Traders need to follow the price action (and indicators) and steer clear of noise and opinions. If the market correction continues, your process (and stops and limits) should offer you new looks on both the long & short side of trades.
Below is my weekly stock market futures trading update and trend outlook. Let’s start by looking at a chart of the S&P 500 ETF (SPY).
S&P 500 Chart – Week 7 (week of February 12)
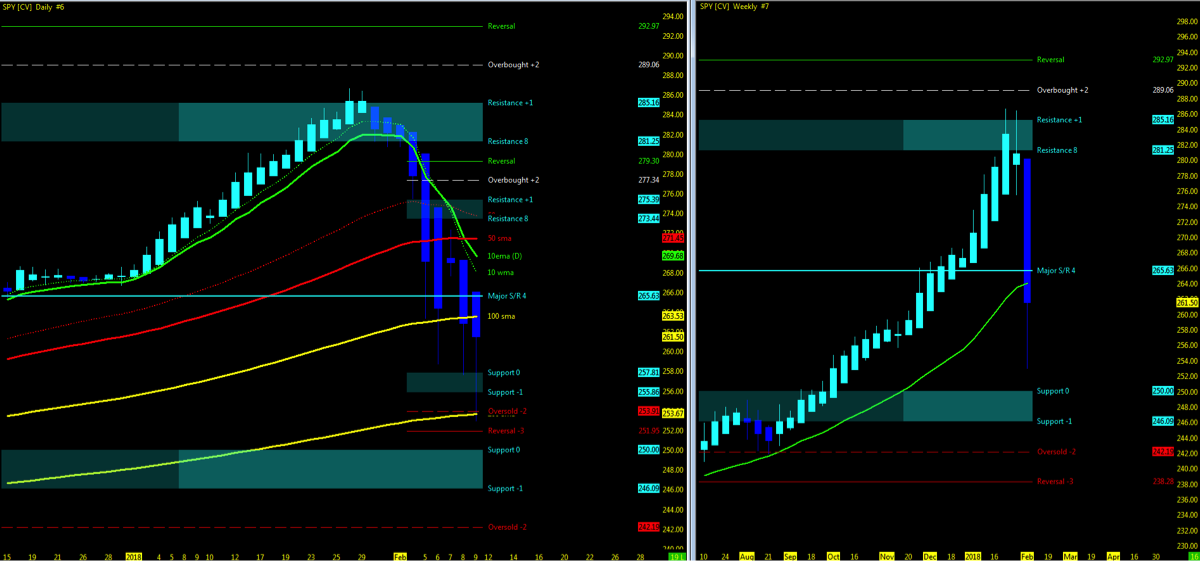
Using the Murray Math Level (MML) charts on higher time frames can be a useful market internal tool as price action moves among fractal levels from hourly to weekly charts. Confluence of levels may be levels of support/resistance or opportunities for a breakout move. Optimal setups will pass through Resistance or Support prior to moving in the opposite trend.
Technical Trends…
- Week 06 recap and trend charts
- Indices continue PULLBACK to 200 period moving averages
- Open Gaps upside; closing downside levels
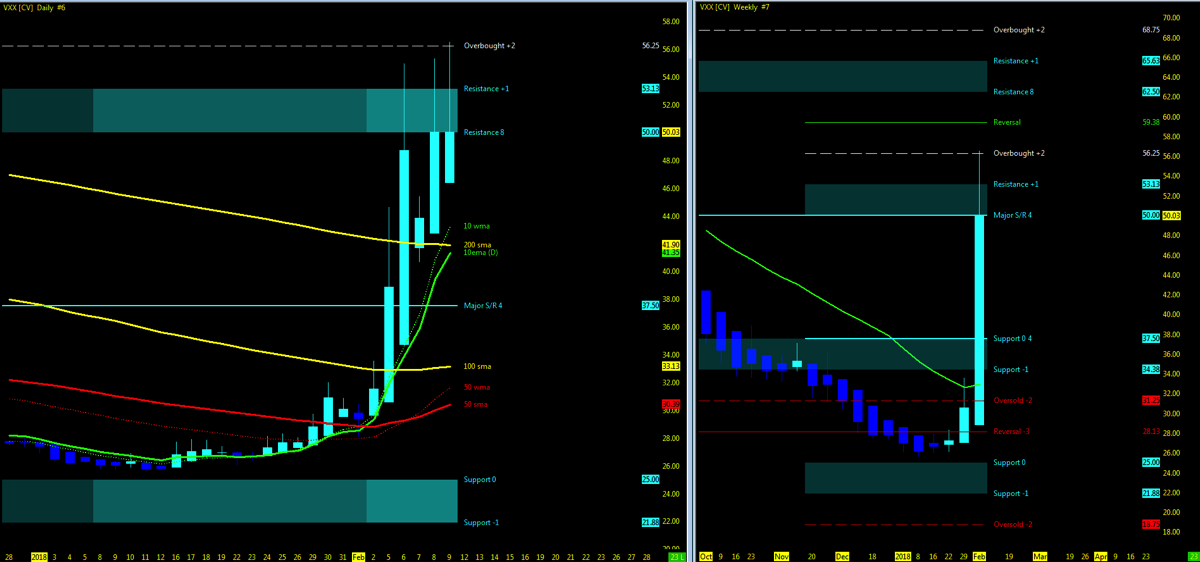
- VIX levels increase to LOW 29’s after peak in high 40’s
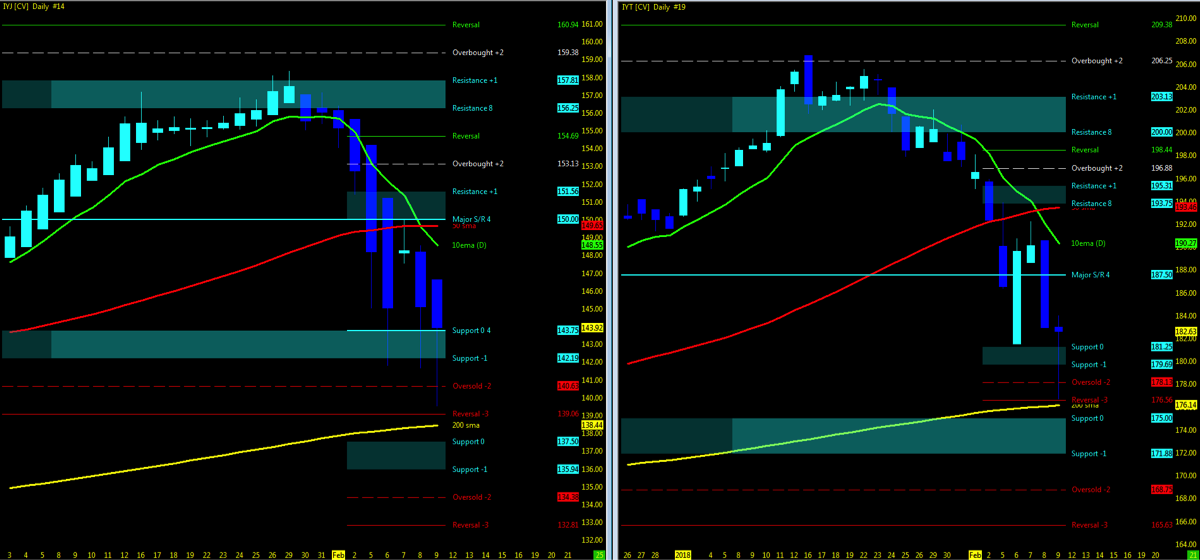
- Industrial/Transports
- Transport’s holding pullback; Industrial’s pullback = IN SYNC
- Monitor for the two ETF indices to remain in sync as supporting indicator of momentum
Key Events in the Market This Week
- USA: Earnings, CPI, January Retail
- GLOBAL: GB: CPI; JP:GDP
- Q4 earnings:
- CSCO, AMD
- Top China Stocks
- Major Hotels
THE BOTTOM LINE
Uptrend Technical Probability
- Indices PULLBACK at all time highs to 200ma’s and bounce
- Price action pushed at MML high resistance on both long and short term levels; pullback and now at support levels
- VXX (VIX ETF) bounce to MML resistance
- UUP – Dollar index momentum BIG PIC remains downside
- VTI support off MML lows and 200ma
- FFTY pullback to 200ma and major support MML levels on Daily and Weekly charts
- FDN (Tech ETF) WEEKLY strong uptrend – earnings remain positive, Moving averages 10>50>200
Downtrend Technical Probability
- Key moving averages out of sync; watch for 10ma crossing 200
- VIX in 20+ zone
- Downside Open Gaps remain open to be closed
- VTI momentum loses strength; closes below 10ma
- NYAD/INDU momentum downside
- Bloomberg Commodity index (BCOM) index weakening
- $DJP 200ma below at Daily MML support
- IYJ/IYT PULLBACK in sync downside below 10ema; watch MML support levels
My 3 Cents
…no guru insight here but truth be told if you are an avid reader of my three cents, you will note how market momentum has played out based on my technical outlook and final confirmation that trend reversed. I have for weeks never called for a top and will never call for a bottom as well. There are many that love to wear that badge and claim that feat however they have been preaching it for months and had it wrong all along. So let’s stick to the technical’s and what big picture lies ahead.
Price action pulled off the MML long and short term support levels to not only close out downside gaps but seek the support off the 200ma, a moving average that saw a bounce intra-week. Surely on all the market and index ETF’s that I monitor for momentum, this could be a pause for rest or consolidation.
Is this the big correction we have all been waiting for? I don’t believe so. The bigger correction will be when technically the charts show moving averages in sync to the downside and MML projection levels continue to push further down without any significant support. So what good am I if I can’t tell you the tops or the bottoms you may ask? Truth be told, I did start telling you where the weakness was showing up at the tops and for the long term investor a time to move up stops and for the swing and opportunity to the short. Of course, for the long term investor an opportunity here to buy at lower prices however I would wait until the end of Q2 and re-balance based on the Jason Kelly 3sig strategy. There is no question that the market is in correction and for the intraday trader it takes discipline to wait for your setups in both directions on higher time frames or to simply just wait this out until the VIX returns to average lower numbers to play in the sandbox.
Week seven will be a decision week to monitor for the institutional support at the 200ma and MML support levels. Indecision means just as much probability to the downside and upside from a technical perspective at this juncture but then again, I’m sure there are those that are adamantly calling for more downside and just as many waving their return to the high flags.
Long term do nothing. Short term monitor 200ma. Intraday; higher time frames till VIX returns to 10-15 levels.
My own three cent wish? More downside for the long term till Q2 close.
Watch for MML setups on price action break above resistance high and back under resistance low for first signs of a pullback. Downside, watch for open gaps to be closed and 50% pullback as 1st level of support.
Attempting to determine which way a market will go on any given day is merely a guess in which some will get it right and some will get it wrong. Being prepared in either direction intraday for the strongest probable trend is by plotting your longer term charts and utilizing an indicator of choice on the lower time frame to identify the setup and remaining in the trade that much longer. Any chart posted here is merely a snapshot of current technical momentum and not indicative of where price may lead forward.
Thanks for reading and remember to always use a stop at/around key technical trend levels.
Twitter: @TradingFibz
The author trades futures intraday and may have a position in the mentioned securities at the time of publication. Any opinions expressed herein are solely those of the author, and do not in any way represent the views or opinions of any other person or entity.


