THE BIG PICTURE
The major stock market indexes continue to hover near all-time highs and remain in up-trends. Market strength has persisted for much longer than most traders anticipated. This is why traders need to follow the price action (and indicators) and steer clear of the noise. When the market begins a pullback, your process should stop you out of the trade… and/or offer new looks on both the long & short side of trades.
Here’s my weekly stock market futures trading update and trend outlook. Let’s start by looking at a chart of the S&P 500 ETF (SPY).
S&P 500 Chart – Week 52 (week of December 25)
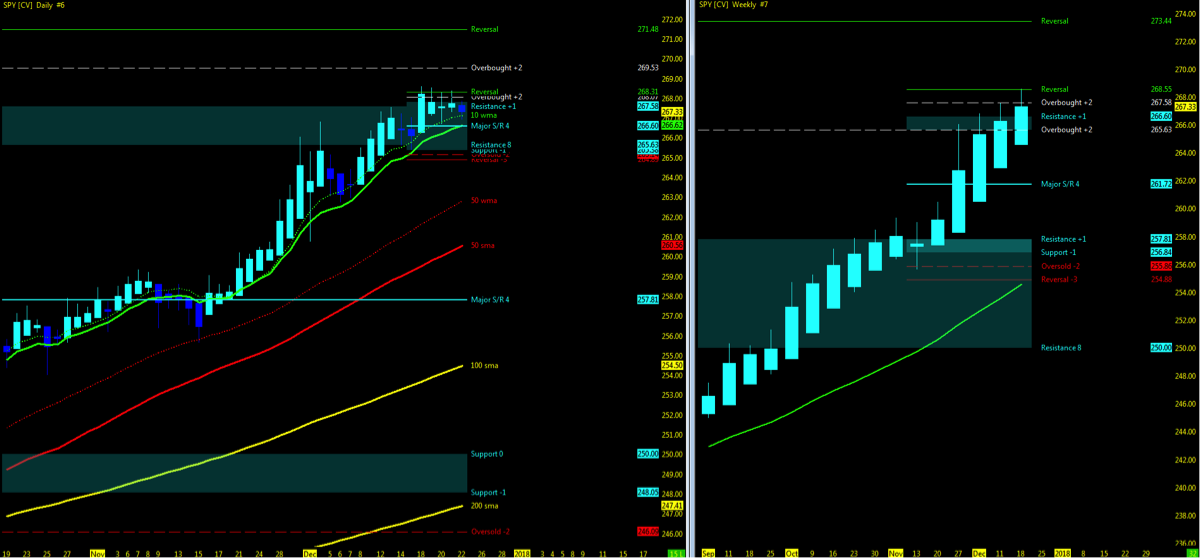
Using the Murray Math Level (MML) charts on higher time frames can be a useful market internal tool as price action moves among fractal levels from hourly to weekly charts. Confluence of levels may be levels of support/resistance or opportunities for a breakout move. Optimal setups will pass through Resistance or Support prior to moving in the opposite trend.
Technical Trends…
- Check out my week 52 recap and trend charts
- The major stock market indices are trading near all time highs
- Open gaps remain downside on all 4 stock indices
- VIX Volatility Index levels are holding near high 9’s
- Dow Industrials / Transports
- Transports breakout to short term MML resistance with Industrial’s consolidated at short term resistance
- Monitor for the two ETF indices to remain in sync upside as supporting indicator of uptrend momentum
![]()
- FANG/FAAMG represented by the FDN (ETF) in Pullback on both Weekly/Daily
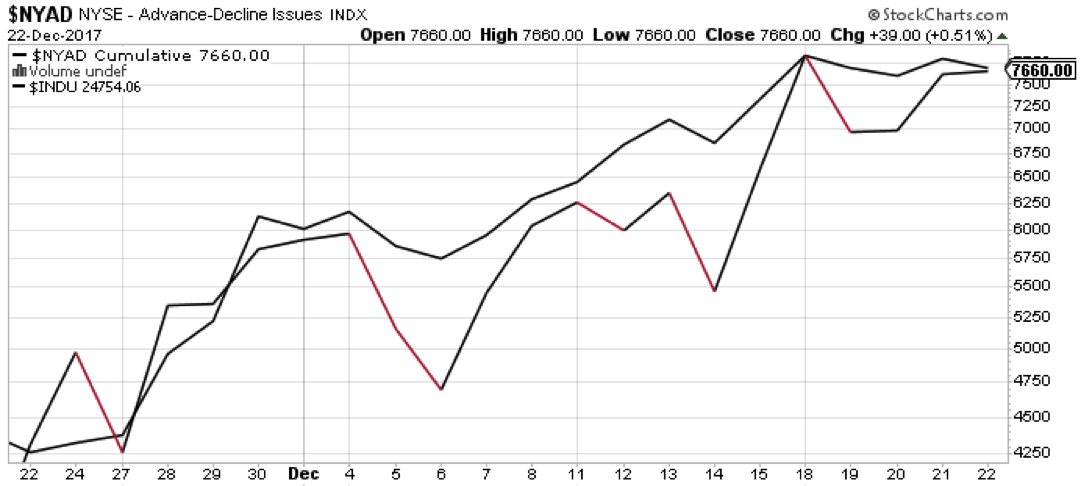
- NYSE Advance – Decline Line trading sideways along with Dow Industrials
Key Events in the Market This Week
- USA: Consumer Confidence, SP Case Shiller
- GLOBAL: JP CPI, CN PMI Manufacturing
- Stocks building a base in consolidation
- Fast Food Restaurants
- Bitcoin: Judgment Week
- Post-Season Retail numbers
THE BOTTOM LINE
Uptrend Technical Probability
- Key moving averages in sync on all stock market indices with no crossovers
- Stock market indices remain at all time highs – tend to go higher
- VIX Volatility Index holding under 10
- UUP – US Dollar index momentum still downside
Downtrend Technical Probability
- Showing technical signs of slowdown in momentum
- FDN/TECH pullback
- IYJ/IYT in sync upside above 10ema with Industrial’s stall
- NYAD/INDU momentum upside
- VTI momentum pullback
- Downside Open Gaps
- Price action pushing at MML high resistance on both long and short term levels
- FFTY Consolidation
- McClennan Adv/Dec indicator struggling to maintain uptrend (@KennyPolcari)
- Bloomberg Commodity Index (BCOM): is not pretty….it is now down 5% since early November and the longer term trendline is downward…… The index has now broken all supports and is struggling to hang on, but with no near-term support in sight. (@KennyPolcari)
- Most equity/index charts show weakness in weekly and monthly time frames (@EDUCOFIN)
The bottom line for me remains the data REMAINS positive with signs of a slowdown or consolidation heading into end of Q4/2018. Tax reform passed and for what it may remain at this point will keep the market up. Monitor for holiday retail sales numbers for next move. Of course at any point, geo-political landscape can change that in a heartbeat. Watch for the Q4 data to set off the the tone for 2018. For now, I view the probability on both sides and as it appears, the momentum remains upside with a definite slowdown. At least for the remainder of the 2017. Watch for lower volume going in to week 52 but that never stopped the trend.
Thanks for reading and remember to always use a stop at/around key technical trend levels.
Attempting to determine which way a market will go on any given day is merely a guess in which some will get it right and some will get it wrong. Being prepared in either direction intraday for the strongest probable trend is by plotting your longer term charts and utilizing an indicator of choice on the lower time frame to identify the setup and remaining in the trade that much longer. Any chart posted here is merely a snapshot of current technical momentum and not indicative of where price may lead forward.
Twitter: @TradingFibz
The author trades futures intraday and may have a position in the mentioned securities at the time of publication. Any opinions expressed herein are solely those of the author, and do not in any way represent the views or opinions of any other person or entity.

: Showing Some Signs of Emerging Strength")
