THE BIG PICTURE
The S&P 500 has been rallying up a vertical wall since the start of 2018. All major stock market indices remain in up-trends but recent action has been volatile. Traders need to follow the price action (and indicators) and steer clear of the noise and opinions. If the market pullback continues, your process should stop you out of the trade… and/or offer new looks on both the long & short side of trades.
Below is my weekly stock market futures trading update and trend outlook. Note that prices are through Friday – sorry for the delay!
Let’s start by looking at a chart of the S&P 500 ETF (SPY).
S&P 500 Chart – Week 5 (week of January 29)
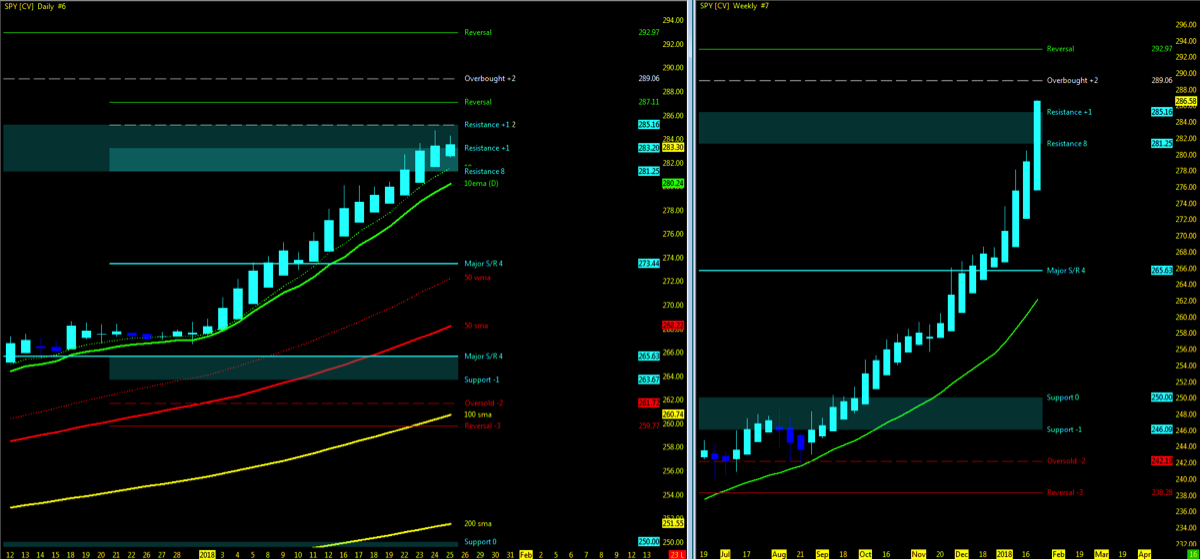
Using the Murray Math Level (MML) charts on higher time frames can be a useful market internal tool as price action moves among fractal levels from hourly to weekly charts. Confluence of levels may be levels of support/resistance or opportunities for a breakout move. Optimal setups will pass through Resistance or Support prior to moving in the opposite trend.
Technical Trends…
- Week 04 recap and trend charts
- Stock market indices made new all time highs; pullback underway
- Open Gaps below.
- VIX Volatility Index levels moving higher
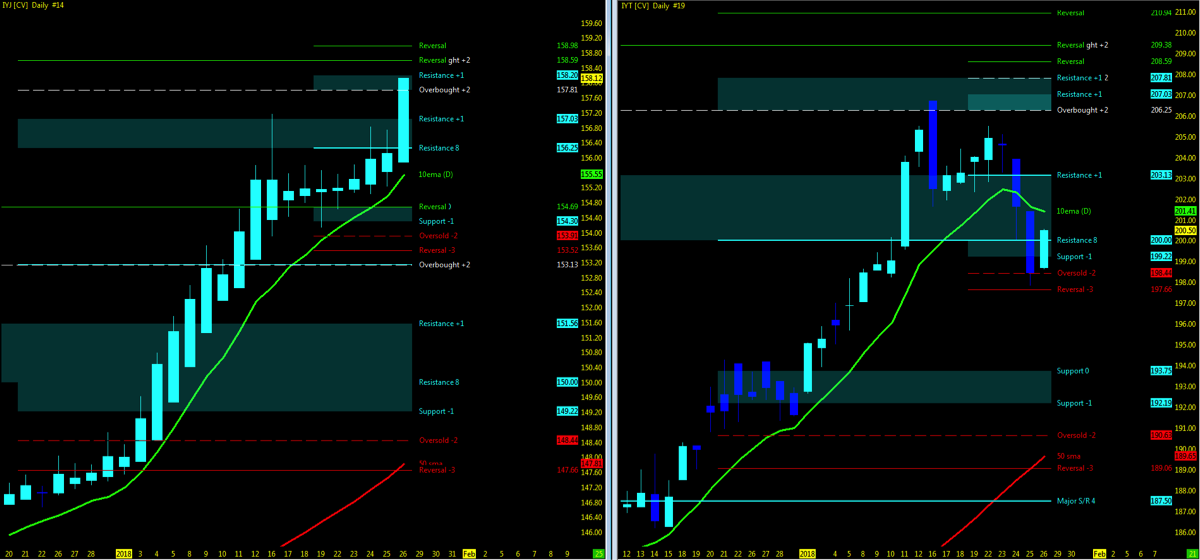
- Industrial/Transports
- Transport’s holding pullback; Industrial’s above 10ma = NOT IN SYNC
- Monitor for the two ETF indices to remain in sync upside as supporting indicator of uptrend momentum
- FANG/FAAMG represented by the FDN (ETF) push highs on Trending HA bars on both Weekly/Daily
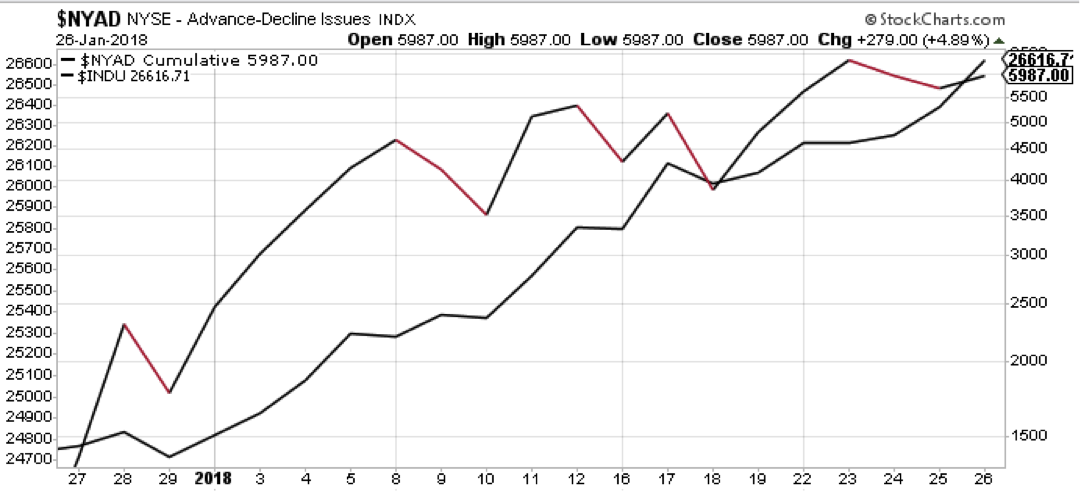
- NYAD (NYSE Advance – Decliners)/INDU in sync upside
Key Events in the Market This Week
- USA: Earnings, NFP, FOMC
- GLOBAL: Australia: CPI
- Q4 earnings:
- FB, APPL, AMZN, GOOGL, BABA, MSFT
- Oil
- Aerospace
The Bottom Line
Uptrend Technical Probability
- Key moving averages in sync on indices with no crossovers
- Indices remain at all time highs – go higher (IBD motto)
- VIX average low
- UUP – Dollar index momentum BIG PIC downside with downside MML targets
- FDN (Tech ETF) strong uptrend
- NYAD/INDU momentum upside
- VTI momentum strong upside
- Bloomberg Commodity index (BCOM) index has surged by nearly 6% since mid-December (@KennyPolacari)
- $DJP breakout after consolidation on daily chart
Downtrend Technical Probability
- Downside Open Gaps pushing further away
- Price action pushing at MML high resistance on both long and short term levels
- IYJ/IYT remain in sync upside above 10ema with IYT pullback
- UUP – Dollar index momentum BIG PIC downside at support – poised for a pullback upside
- FFTY pullback; crawl back to highs – need a breakout to move to Uptrend Probability
- Technical indications (MACD) of an extended market (@EDUCOFIN)
- iPhone X sales not coming in as expected; reports out this week
- Bloomberg Commodity Index (BCOM); 5 sub-indices sectors above out of 18 total.
My 3 Cents
…as I am posting this after day 1 of week 5 and markets have pulled back off the highs of last week, the overall trend simply remains upside. the case for both probabilities is balanced and all it will take is for some Jedi Trader to sneeze and hit the wrong button. I remain in belief that 2018 will still offer the market an opportunity for correction and the timing of it will happen when it does. This week could offer us a correction if the earnings to report, and they are the big ones don’t play out as expected we could see some pullback. Watch for FOMC and NFP data to set the tone as well. By all technical indicators, watch that 10ema for first signs of downtrend correction.
Watch for MML setups on price action break above resistance high and back under resistance low for first signs of a pullback. Downside, watch for open gaps to be closed and 50% pullback as 1st level of support.
Attempting to determine which way a market will go on any given day is merely a guess in which some will get it right and some will get it wrong. Being prepared in either direction intraday for the strongest probable trend is by plotting your longer term charts and utilizing an indicator of choice on the lower time frame to identify the setup and remaining in the trade that much longer. Any chart posted here is merely a snapshot of current technical momentum and not indicative of where price may lead forward.
Thanks for reading and remember to always use a stop at/around key technical trend levels.
Twitter: @TradingFibz
The author trades futures intraday and may have a position in the mentioned securities at the time of publication. Any opinions expressed herein are solely those of the author, and do not in any way represent the views or opinions of any other person or entity.


