THE BIG PICTURE
The major stock market indexes recovered from a quick intraday pullback last week and remain in up-trends. Strong markets are staying stronger for longer than most traders anticiapated. This is why the best thing for traders to do is follow the price action and steer clear of the noise and anticipating the next move. When the market begins a pullback, your process should stop you out of the trade… and/or offer new looks on both the long & short side.
Here’s my weekly stock market futures trading update and trend outlook. We’ll start by taking a look at the S&P 500 (NYSEARCA:SPY).
S&P 500 Chart – Week 49 (week of December 4)
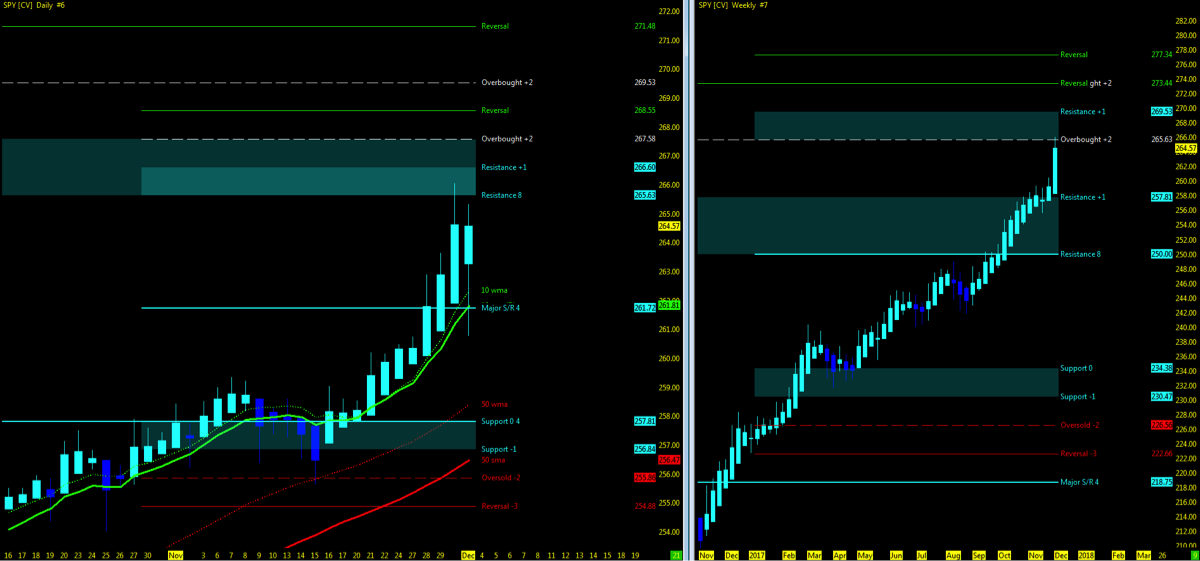
Using the Murray Math Level (MML) charts on higher time frames can be a useful market internal tool as price action moves among fractal levels from hourly to weekly charts. Confluence of levels may be levels of support/resistance or opportunities for a breakout move. Optimal setups will pass through Resistance or Support prior to moving in the opposite trend.
Technical Trends…
- Week 48 recap and trend charts
- Stock market indices hits new all time highs.
- Friday’s deep selloff on News event quickly recovers back to open.
- Open gaps remain downside on all 4 stock indices.
- VIX Volatility Index (INDEXCBOE:VIX) moves up to 11+.
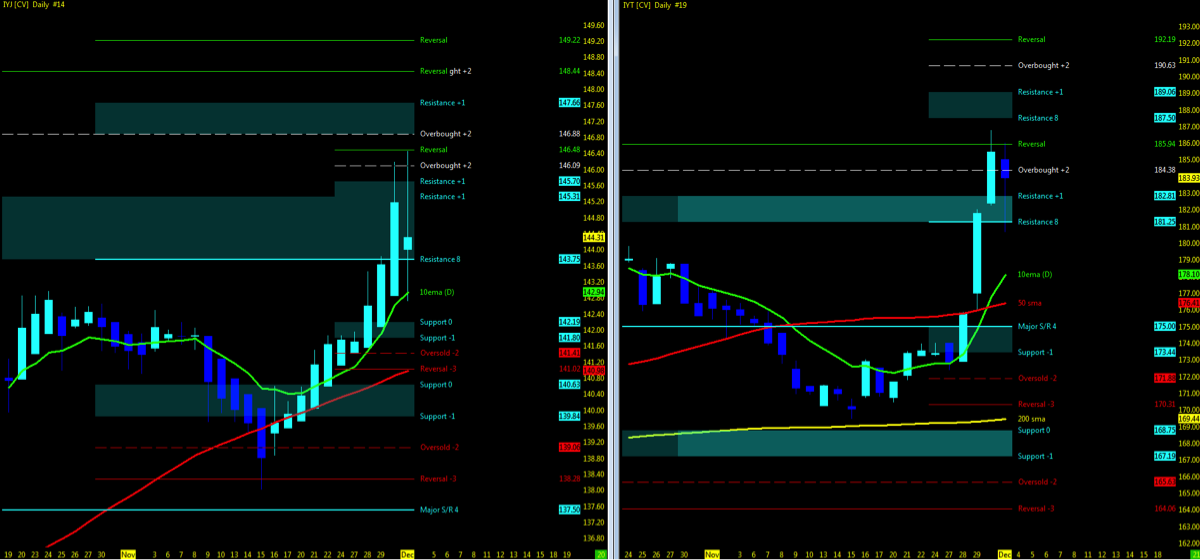
- Industrial/Transports (XLI / IYT)
- Daily Heikin Ashi bars breakout in sync at MML resistance
- Watch for these two ETF indices to remain in sync upside as supporting indicator of uptrend momentum
- FANG/FAAMG in pullback.
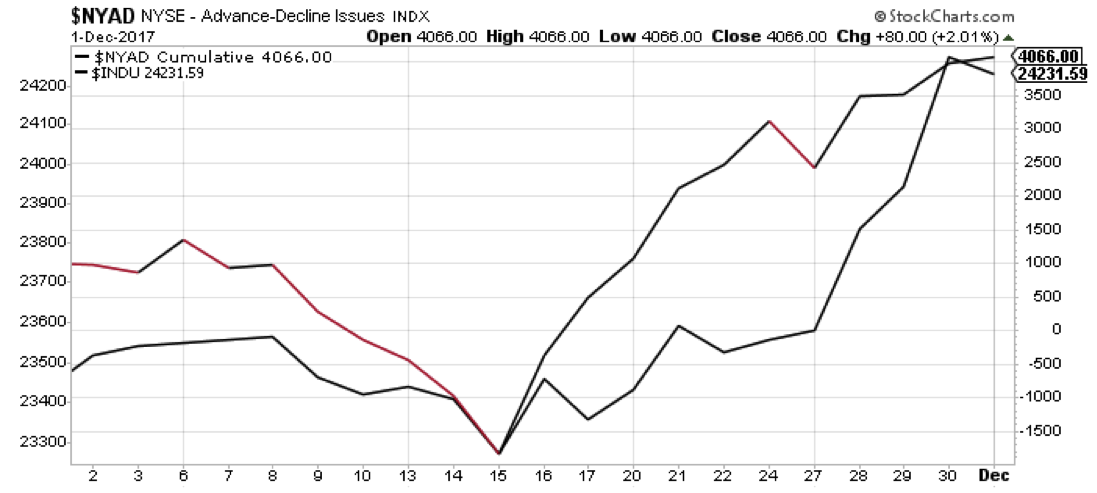
- NYSE Advance – Decliners in sync upside with end of the week pullback
You can also watch my Weekly Market Outlook Video
Key Events in the Market This Week
- USA: Employment data
- GLOBAL: Australia GDP, China CPI
- Q3 Earnings Season
- Broadcom, Toll Bros
- Discount Chains
- Contract rollover on many platforms
- 1 week to FOMC
THE BOTTOM LINE
Uptrend Technical Probability:
- Key moving averages in sync on indices with no crossovers
- Indices remain at all time highs – go higher (IBD motto)
- UUP – Dollar index momentum downside
- IYJ/IYT in sync upside above 10ema
- Low VIX Average
- NYAD/INDU momentum upside
Downtrend Technical Probability:
- VIX average though low now holding above 11
- Downside Open Gaps closed in week 48 with many more below
- Price action pushing at MML high resistance on both long and short term levels
- CANGX pullback now follows with FFTY/VIX pullback
Count up the indicators and you will get “50%” that show signs of the tops leading to downside price action and the remaining indicators are pointing even higher. With new all time highs in week 48 and after the news related event (which now has been revealed to be falsely reported) and consequential drop to only regain its momentum upside, it is a tough case to see the market recoiling as of yet. I stand by week 48’s probability that we continue to go higher or at least consolidate at the highs without any major drop yet. Now, I can also be way off here and subscribe to all the permabears bubble status of the market but with the few sector ETF’s I follow and the core strategy of my trend momentum, nothing indicates to me that the market is going to turn downside in any major correction as of yet. Tax reform, Q3 positive earnings and holiday sales may be just enough to keep the market upside….for now.
Attempting to determine which way a market will go on any given day is merely a guess in which some will get it right and some will get it wrong. Being prepared in either direction intraday for the strongest probable trend is by plotting your longer term charts and utilizing an indicator of choice on the lower time frame to identify the setup and remaining in the trade that much longer. Any chart posted here is merely a snapshot of current technical momentum and not indicative of where price may lead forward.
Thanks for reading and remember to always use a stop at/around key technical trend levels.
Twitter: @TradingFibz
The author trades futures intraday and may have a position in the mentioned securities at the time of publication. Any opinions expressed herein are solely those of the author, and do not in any way represent the views or opinions of any other person or entity.


