If you are having a hard time figuring out the market’s next moves, here’s a recap:
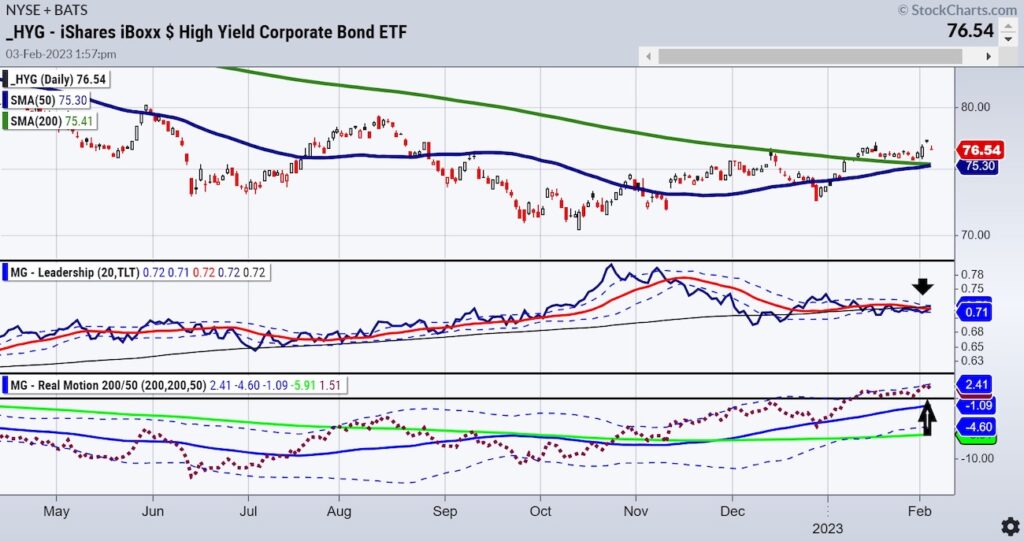
- On the one hand, finally, the high yield bonds are just starting to outperform the long bonds-risk on. (See down arrow)
On the other hand, the real motion momentum indicator flashed a mean reversion on junk bonds. (See up arrow).
So the indices are stuck. The bond relationships are stuck. The economic data is stuck. Recession coming or soft landing achieved? Stuck.
What about inflation, geopolitical stress, climate issues and food shortages along with wage increase demand and social unrest?
Stuck.
Perhaps the Economic Modern Family can help.
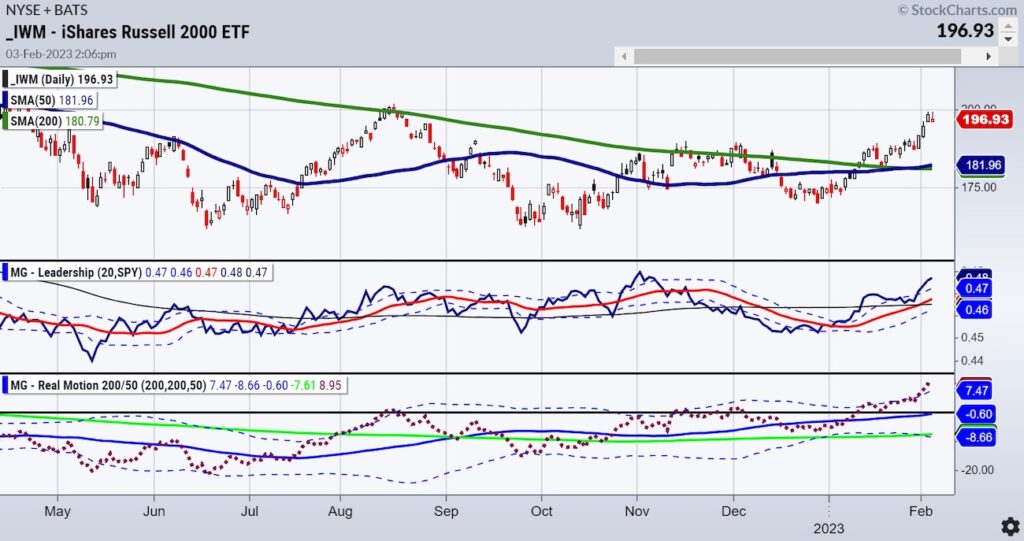
The Russell 2000 (IWM) or Granddad of the Economic Modern Family, had a golden cross, and cleared the December highs (not the August ones though).
$202 is where major resistance from the 23-month MA sits. Real Motion shows new highs in momentum. A positive.
Triple Play shows leadership against the benchmark. A positive.
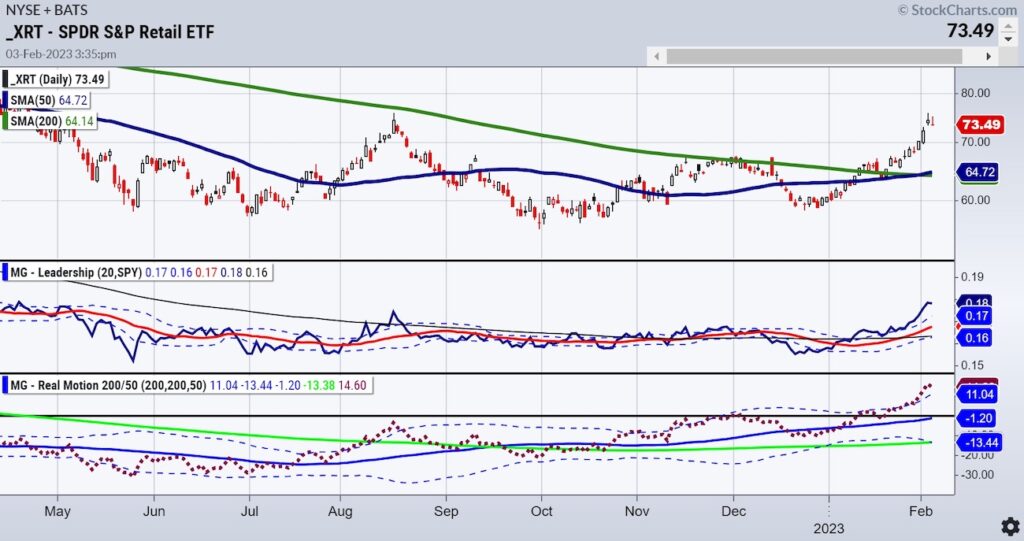
Granny Retail (XRT) shows similar technical patterns.
Forget the rest and just look at Granny and Gramps, one should think blue skies.
Look at the 23-month moving average though at 78.00, and XRT trades well below that level.
Until proven otherwise, trade with a mindset that the market is approaching the top of the range.
Also, do not get overly complacent about inflation peaking-we still see a potential trainwreck.
However, the modern family has an amazing track record. That means above these range resistance levels, follow their lead.
Mish’s latest in the Media:
Yahoo Finance Week Wrap up 02-03-23
Stock Market ETFs Trading Analysis & Summary:
S&P 500 (SPY) Target 420 with 390-400 support
Russell 2000 (IWM) 190 now support and 202 major resistance
Dow (DIA) 343.50 resistance and the 6-month calendar range high
Nasdaq (QQQ) 300 is now the pivotal area
Regional banks (KRE) 65.00 resistance
Semiconductors (SMH) 246 is the 23-month moving average-can she hold? Sister Semi’s is the hare this past week
Transportation (IYT) It’s like chips are on a bullet train-this 23-month MA is 244-we are back below that level
Biotechnology (IBB) Sideways action
Retail (XRT) 78.00 the 23-month MA resistance and nearest support 68.00
Twitter: @marketminute
The author may have a position in mentioned securities at the time of publication. Any opinions expressed herein are solely those of the author and do not represent the views or opinions of any other person or entity.


