This week’s stock market reversal wasn’t a big surprise as a number of stock market indices were trading up into either an ellipse sell zone, 200-day average, or upper end of price channel resistance.
That said, it could be an important reversal.
Today we share two insights: 1) The S&P 500 price reversal could be the start of the next leg lower for this bear market (see chart below). 2) The S&P Regional Banking ETF (KRE) has very weak money flow… and after running the 145 constituents in our multi-factor model we found that 71% of the stocks have a very poor score. Careful here.
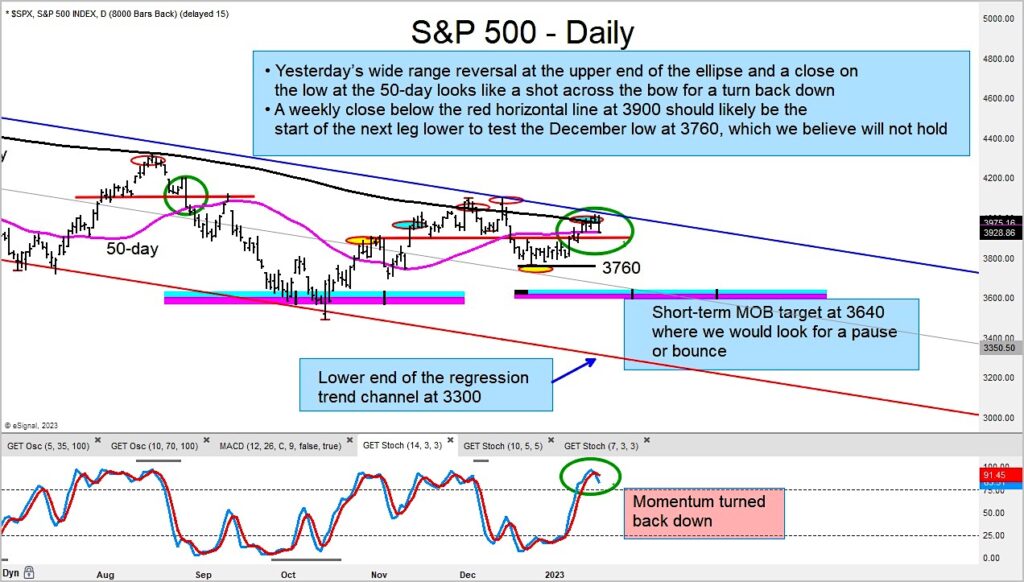
Below is the chart of the S&P 500 Index on a short-term “daily” basis. As you can see, we could be headed down to 3640 or lower yet.
S&P 500 Index Chart
Twitter: @GuyCerundolo
The author or his firm have a position in mentioned securities at the time of publication. Any opinions expressed herein are solely those of the author, and do not in any way represent the views or opinions of any other person or entity.


 Ready To Break Out?")


