Thursday’s stock market reversal was well timed, coming after the Fed announcement. However, it wasn’t all that surprising, as the market reversal took shape at a critical resistance point on the S&P 500 chart.
Today, I want to share with you a chart that I also shared earlier on StockTwits (see message here).
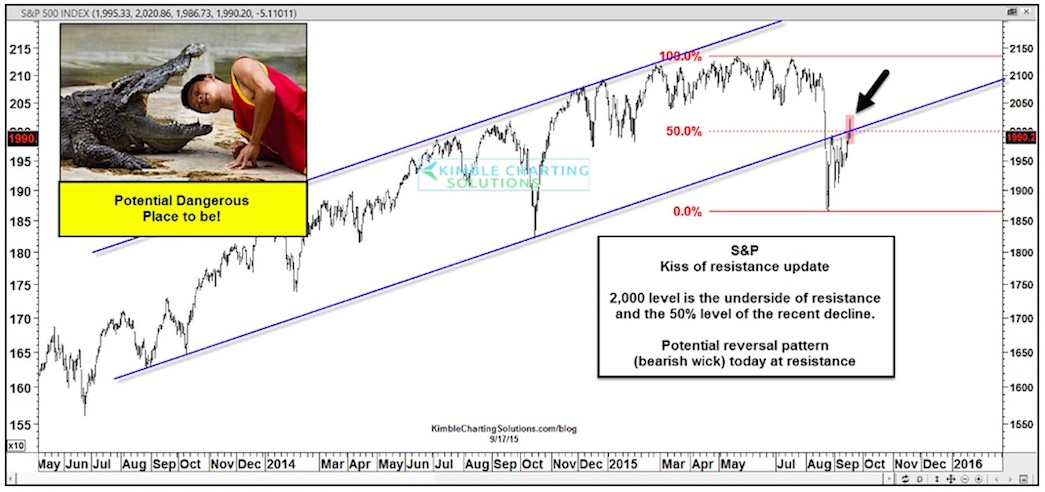
While the world was focused on what Fed Chair Janet Yellen had to say, many active investors were likely missing out on a very important pattern that was taking shape on the S&P 500 Index. And that may have left them vulnerable to the violent stock market reversal that took shape yesterday. click chart to enlarge
S&P 500 Chart – Watch That Resistance!
Let’s look at one more chart (see below). I shared this chart last week in a post here on See It Market highlighting key overhead resistance on the S&P 500. I suggested that the S&P 500 could be in big trouble if it couldn’t “knock down” this resistance level.
S&P 500 Chart – Watch That Channel!
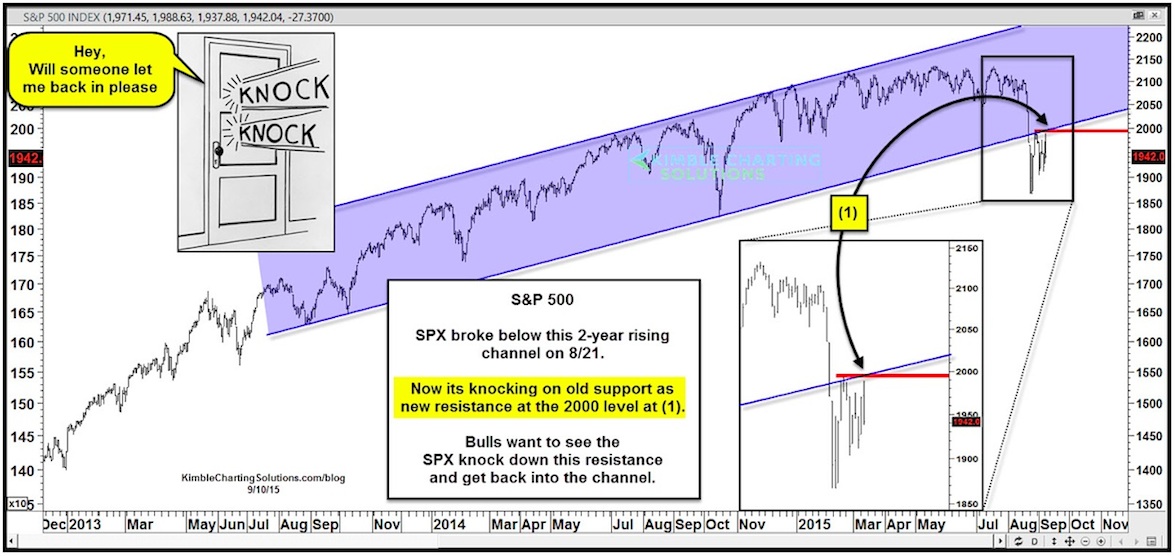
This chart was shared 8 days ago, reflecting that the S&P 500 was on the underside of this resistance channel, attempting to climb back inside and that the 2,000 level was very important.
The stock market reversal pattern reflected in top chart created a bearish wick at dual resistance… and looks to have taken place at a dangerous price point.
Thanks for reading.
Twitter: @KimbleCharting
Any opinions expressed herein are solely those of the author, and do not in any way represent the views or opinions of any other person or entity.


")
