Stocks added to their gains last week as investors watched an early March stock market rally unfold.
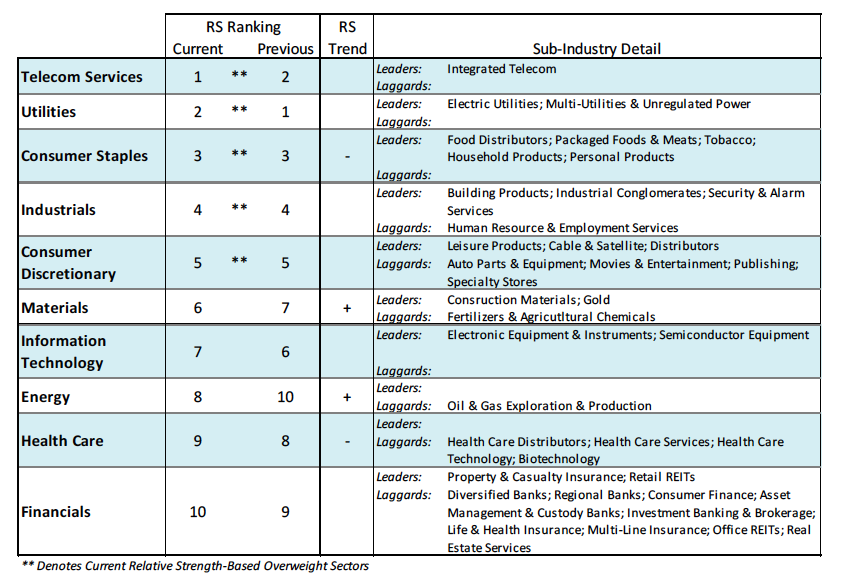
The S&P 500 posted its third consecutive weekly gain of more than 1%, and March is off to one of its best starts in history (up 3.5% after four trading days). While the S&P 500 still remains down nearly 2% on a year-to-date basis, six of the ten stock market sectors are actually in positive territory for 2016 (Industrials, Materials and Energy have joined Staples, Utilities and Telecom in that camp).
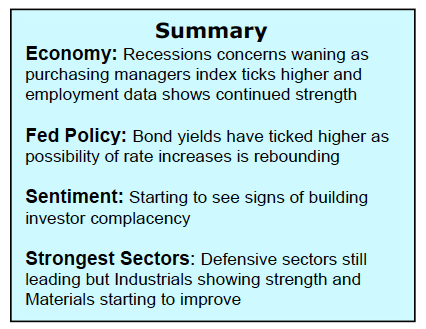
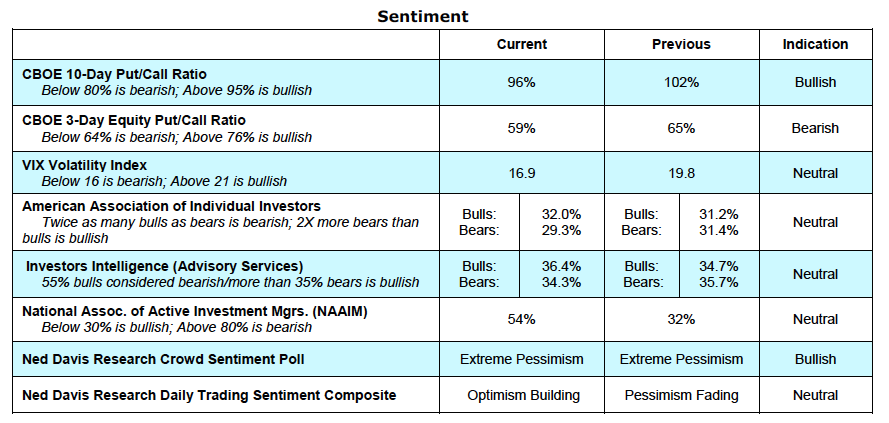
Near-term market breadth and momentum have improved as stocks rallied off of their February lows, but there is now evidence that the move has gotten ahead of itself. Investor sentiment has moved from excessive pessimism to rising optimism with pockets of increasing complacency.
Demand for put options dropped sharply over the course of last week and the VIX is at its lowest level since December. The 200-point move by the S&P 500 over the past 15 trading days has left an increasing number of stocks, sectors, and the market itself (as seen in the low TRIN readings last week) in overbought territory. Importantly, this rally comes without evidence that the longer-term price trend has turned higher and with both valuations and the broad market remaining headwinds. With resistance just ahead, and absent strong evidence of longer-term breadth improvement, stocks could struggle to continue to build on their recent gains.
So, what’s behind the early March stock market rally?
An interest rate hike at the March FOMC meeting remains unlikely, but recent economic data has helped validate the Fed’s decision to raise rates back in December. The February ISM Purchasing Manager’s Index exceeded expectations, and both the New Orders and Production components indicate increased activity for the second month in a row. The Non-Manufacturing ISM report for February showed activity in the services sector remains firm. Concern over the decline in the employment component of the services sector report diminished after the release of the February payrolls data. The establishment survey showed an increase of 242,000 jobs, well ahead of the 195,000 new jobs that were expected. Labor force participation ticked higher even as the overall unemployment rate held steady at 4.9% and the expanded U-6 unemployment rate fell from 9.9% to 9.7%.
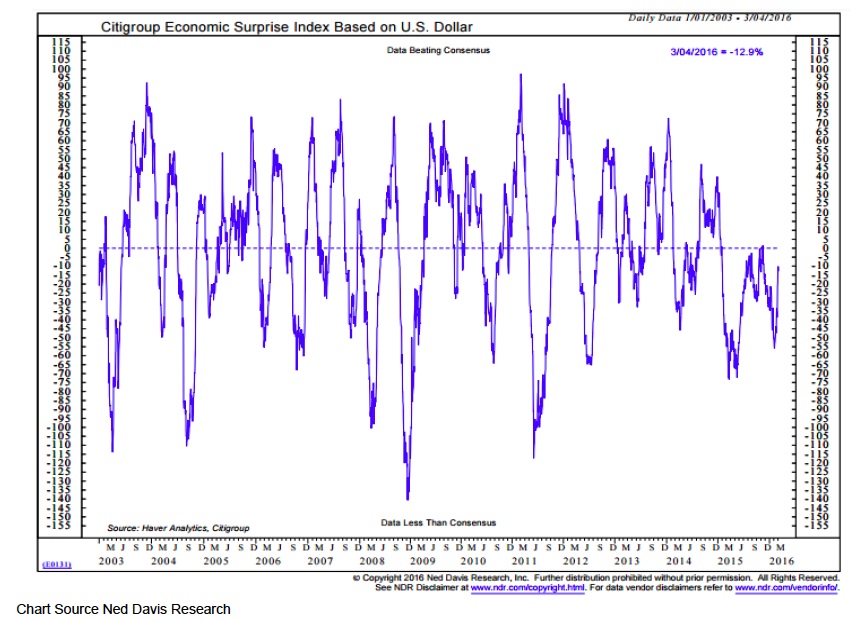
This spate of better-than-expected economic data has led to a sharp rebound in the economic surprise index, which is up 42 points over the past month. Bond yields have also reversed course from their early-year pattern. The yield on the benchmark 10-year T-Note has risen from a mid-February low of 1.64% to close last week at 1.88%, still shy of where it began the year (2.27%).
Thanks for reading.
Twitter: @WillieDelwiche
Any opinions expressed herein are solely those of the author, and do not in any way represent the views or opinions of any other person or entity.


")


