Yesterday move to new multi-day lows on several stock market indices failed to cause any real technical damage. The S&P 500 (NYSEARCA:SPY) reversed losses to close nearly unchanged by the close (and other indices followed). But traders have gone quiet and stock market holiday trading is expected to light into the weekend.
Small-caps have lagged a bit along with Emerging markets, but none of the broad indices has suffered any significant technical damage.
With just five more full trading days left in the month, it still looks likely that indices can push back higher and move to new highs territory into year end before any larger stallout occurs. And this should be lead by strength in Financial stocks (NYSEARCA:XLF), Semiconductor stocks (NASDAQ:SOXX), and Energy stocks (NYSEARCA:XLE). Health Care and Retail stocks continue to lag. The Tech sector still looks to be an area to favor in the days ahead, as Semiconductors (SOXX) have another 3-4 days of upside before they likely stall out.
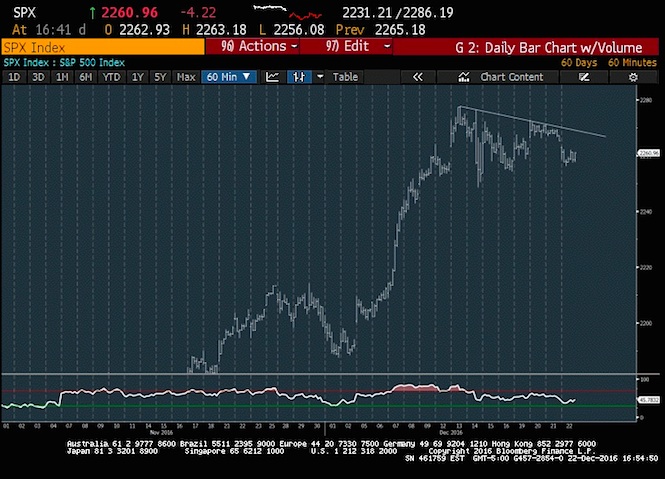
The S&P 500 Chart
S&P 500 hourly charts detail the ongoing consolidation that has gripped US Equities since mid-month, with nearly nine days of no net change in price following an almost a 10% rise from early November. This stock market consolidation has helped to alleviate overbought conditions, yet has still not shown sufficient deterioration to think a pullback is imminent. Given that markets have five full trading days left in the year, bullish seasonality tendencies would suggest a move back higher is likely than any meaningful pullback. Thursday’s attempted weakness which threatened to take indices down to weekly lows turned out to be nearly a non-event by the close, as prices regained nearly all of the early losses. Bottom line, the trading range from early December remains intact until/unless 2242 is broken. For Friday’s trading ahead of the long holiday weekend, movement back up to test and breakout above 2272 looks more likely than a break of 2242.
Note that you can catch more trading ideas and market insights over at Newton Advisor. Thanks for reading.
Twitter: @MarkNewtonCMT
Any opinions expressed herein are solely those of the author, and do not in any way represent the views or opinions of any other person or entity.

: Showing Some Signs of Emerging Strength")
