S&P Futures Near-Term Outlook: (2-3 Days) Bearish – Still no evidence that the S&P 500 (INDEXSP:.INX) is bottoming, despite a mild bounce attempt from Tuesday’s close. Tuesday brought about hugely climactic readings in TRIN, with 94% of the volume on the downside. Tests of 2107 in September S&P 500 futures look likely. A move below 2107 could lead to 2100 or 2092-3 which I believe would be an opportunity to buy ahead of next week’s Federal Reserve meeting. A move back above 2151 could allow for minor upside. That said, a move back above 2163 is necessary for confidence that the stock market pullback is over.
2134-5, 2128, 2107, 2100, 2092-3 Support
2158-60, 2177-78, 2189-90, 2197-2200 Resistance
TECHNICAL THOUGHTS
Volatility (INDEXCBOE:VIX) has come back with a vengeance after our 2 straight months of lackluster trading. After nearly 40 + days of the narrowest trading we’ve seen in years, now we have three straight 1% + days in a row. (Down, Up, Down). And all of these moves have occurred within 3% of all-time highs. The last time this happened was 2013 ,and prior to that, back in 1999.
Rapid about-face type moves can often occur in volatile declining tapes, but rarely with the market so close to all-time highs. There remains little reason to try to step in and pick the lows for this stock market pullback. This is supported by the uncertainty regarding next week’s FOMC Federal Reserve meeting. I am also not seeing any strong signs of positive momentum divergence and/or Demark buys on intra-day timeframes for US stock market indices.
The volatility seems to be just beginning after nearly two months of sideways, so it’s difficult to use the first evidence of breakdown and volatility to buy. Historical volatility on a 30-day basis has doubled in the last two weeks from near 5% to over 11% in a very short period of time. For now, the near-term trend remains bearish. However, as part of an ongoing bullish structure, there is a lot of important support down near 2090-2100. And this area represents both trendlines from February along with the successful retest of the July breakout.
Interestingly enough, bonds have also started to show above-average signs of weakening, despite the downward volatility in equities. Normally an equity selloff might lead to Treasuries rallying hard, but we’ve seen exactly the opposite. Some of this weakness is based on the remote possibility of a Federal Reserve hike next week. And tepid auction demand caused further flight from Treasuries yesterday. This yield rally looks increasingly dependent on a hike to stay afloat, so lack thereof next week would likely result in most of these gains being reversed, along with seeing outflows from Utilities and Telecomm.
With regards to equities, no real positive divergence is present at this time on hourly or two-hour charts of the S&P 500 Index to suggest an upcoming bounce and Demark indicators aren’t really lining up just yet on various intra-day timeframes to suggest a bounce is near. the McClellan Oscillator, which normally can begin to trade higher ahead of equities, remains below its 5-day moving average with no evidence of turning up. The one positive factor has to do with the percentage of volume into Declining stocks, which yet again reached over 90%, the second 90% DOWN day in the last 3. TRIN readings at the close spiked to nearly 3, a hugely climactic reading that often can suggest the selling has been overdone. However, one must remember that this triggered high readings in the past when equities were near highs, as in the latter part of 2015 which also proved important.
Chart source: Bloomberg
S&P 500 Futures Trading Range Breakdown
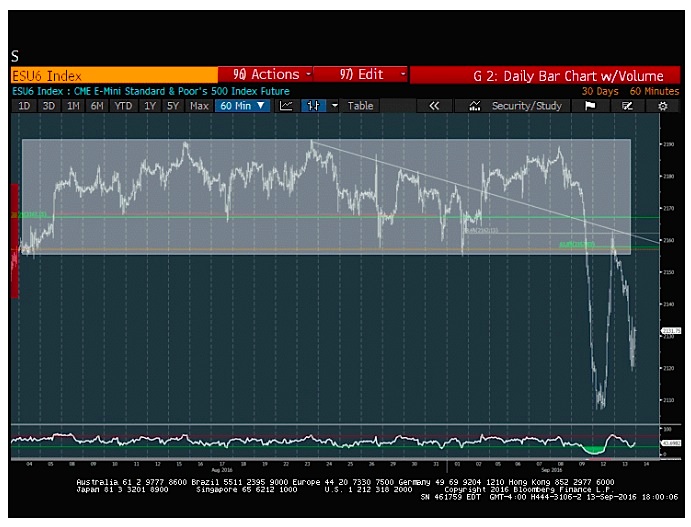
The S&P 500 gave back 70% of Monday’s gains. It still looks ripe for a test of lows or slightly under before any bounce unfolds. Market momentum turned back negative with Tuesday’s decline, and closing near the days lows still makes it more likely that 2107, the Monday low should be tested, if not briefly undercut before any real low of magnitude is in place. For now, the extent to which prices retraced nearly all of Monday’s gains seems like a bigger negative (along with representing another 90% Down day). While these often can represent buying opportunities after a larger correction, it seems unlikely here. We’ve just seen a 1-2 day stock market pullback. And which results in capitulation in volume to the downside should be meaningful to buy just yet.
S&P cash index’s decline remains part of a larger uptrend for equities, and this first retest of a major breakout area should likely represent good support for the weeks ahead. For now, it still seems a bit unlikely that the worst is over, and areas down near 2100 and then 2092-3 stand out as being more important. Any breach of last Friday/Monday’s lows would cause some positive divergence to appear on hourly charts which coupled with some uptick in fear, would suggest that trading lows are near. For now, it still looks a bit early.
Thanks for reading.
Twitter: @MarkNewtonCMT
Any opinions expressed herein are solely those of the author, and do not in any way represent the views or opinions of any other person or entity.


