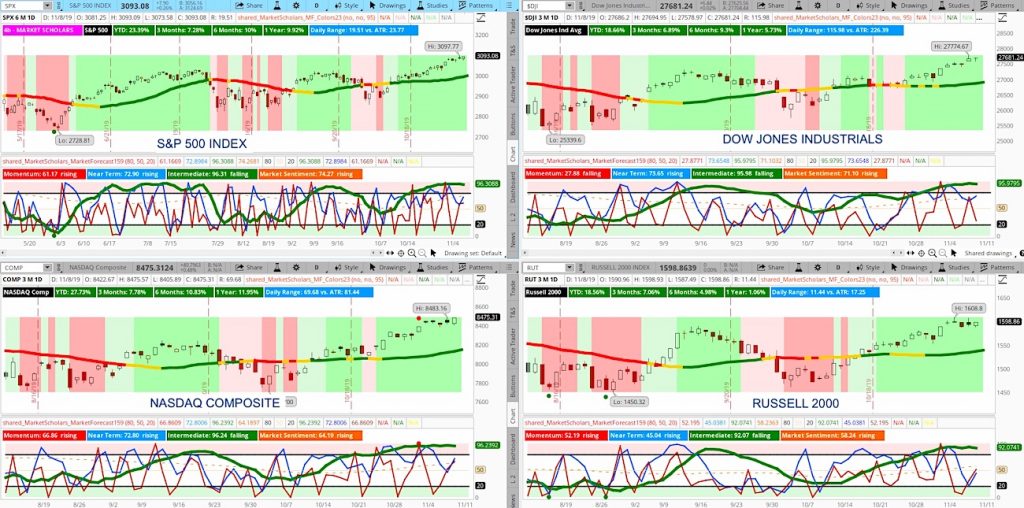
This week, the S&P 500 Index INDEXSP: .INX near-term line stayed above the chart’s midpoint (now for 22 days) – this is well beyond its normal range and longest since July 2016. This pattern may lead to shorter and more frequent near-term runs in the upcoming week or two.
After the prior week’s Heikin Ashi breakout pattern occurred on the S&P 500, all of the other major stock market indexes showed their own weekly Heikin Ashi breakout patterns this past week.
The rubber band remains stretched with the four-week range flirting with 5% of the high. This will limit upside moves – if not in direction, in magnitude.
Summary: The posture remains strongly bullish with all the major indexes now showing strong bullish intermediate postures combined with rising six-week moving averages and rising Market Sentiment lines above the chart’s midpoint.
The Russell 2000 and NASDAQ Composite have shown near-term pullbacks lately where the S&P 500 has not. This divergence suggests there may be an exhale coming this week that brings all four charts back in short-term alignment before the bullish intermediate run re-engages and targets the end of the year.
Get market insights, stock trading ideas, and educational instruction over at the Market Scholars website.
Stock Market Video – for week of November 11, 2019
Twitter: @davidsettle42 and @Market_Scholars
Any opinions expressed herein are solely those of the author, and do not in any way represent the views or opinions of any other person or entity.


: Showing Some Signs of Emerging Strength")
