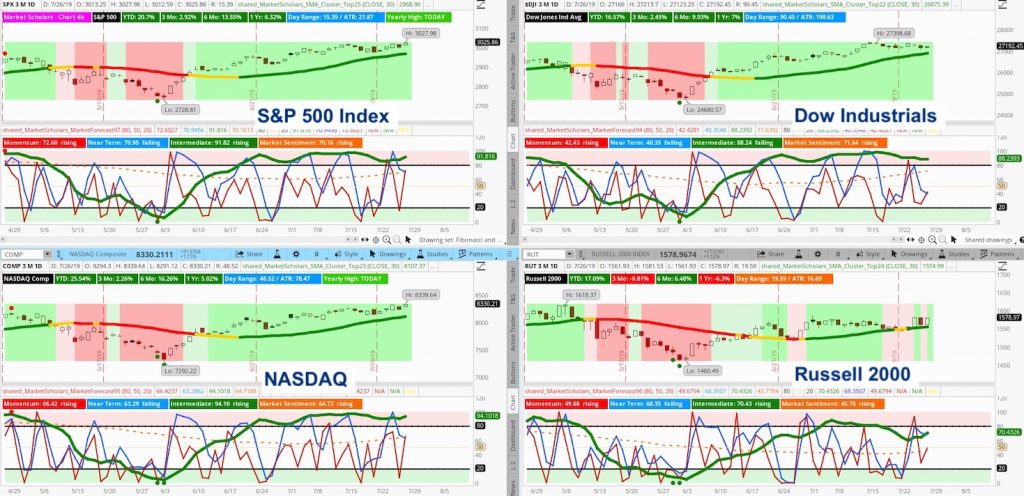
For another week, the S&P 500 Index – INDEXSP: .INX – shows strong bullish intermediate posture (green line above 80 on Market Forecast) and rising Market Sentiment (orange line)
Short-term sentiment is improved with the near-term line (blue) finishing the week in the upper half of the chart and rising momentum line (red).
The Russell 2000 Index – INDEXRUSSELL: RUT – continues to lag but had a good week of outperformance that may kickstart a longer run moving higher against the S&P. Its intermediate line fell below the 50th percentile, which means it has room to run compared to the other major indexes where the intermediate line has stayed at high levels the past few weeks.
Is this bull market in a state of mature optimism or euphoria yet? Sector correlations suggest the bull market may continue. Usually, correlations drop as markets mature and, outside of Energy and interest-rate-sensitive areas like Utilities and Real Estate, relationships among other sectors are still very strong.
Today’s late rally and close near at the week’s high save the Heikin Ashi weekly candle from turning into a transition candle – one that would signal a possible intermediate pullback. Instead, the S&P closed with another strong bullish candle that suggests more upside for equities.
After testing its 17-day exponential moving average (EMA) last Friday, the S&P bounced this week back above its rising 8-day EMA. Both lines are used for the MACD indicator in the 3-green-arrow signal. The MACD and Stochastic indicators started to rise again and cross above their respective moving averages in the upper halves of their charts.
The large-cap index pushed up to new four-week highs. Its four-week lows will move up dramatically next week. Because of this week’s new highs, it helps the S&P avoid tightening into a narrow channel that would signal pullback potential. Instead, the new 4-week highs open the door to more room to the upside before the range widens out to a “stretched out” amount.
Stock Market Video – Forecasting the Week Ahead (July 29)
Volumes and trading ranges hit average levels for most of the week. Averages are at very low levels but do not signal any signs that the bullish long-term trend may be running out of gas.
Volatility hit is lowest weekly close since last October. But, unlike October, this is the first time closing at these lows whereas volatility spent weeks in this area before stocks peaked in early October.
SUMMARY ANALYSIS: The posture remains strongly bullish. Even though there are plenty of reasons for people to worry about the current trend’s sustainability, the reality is that price action supports a still growing trend.
There are divergences appearing in different indicators and accumulation is slowing down but this is typical of all bullish grinds when volatility is low. There are still no signs markets are either overly mature or euphoric. Instead, more and more signs suggest there is still plenty of upside left heading into year end and early next year – even if there may be short, temporary pullbacks in between.
Twitter: @davidsettle42 and @Market_Scholars
Any opinions expressed herein are solely those of the author, and do not in any way represent the views or opinions of any other person or entity.

: Cup (and Maybe Handle) Watch")
 Trading Near Top Of Price Range")

