Key Stock Market Takeaways:
S&P 500 Index (INDEXSP: .INX) making new highs though rally still less than ideal.
Market breadth improving but has not confirmed price highs.
Investor optimism getting elevated for both stocks and bonds.
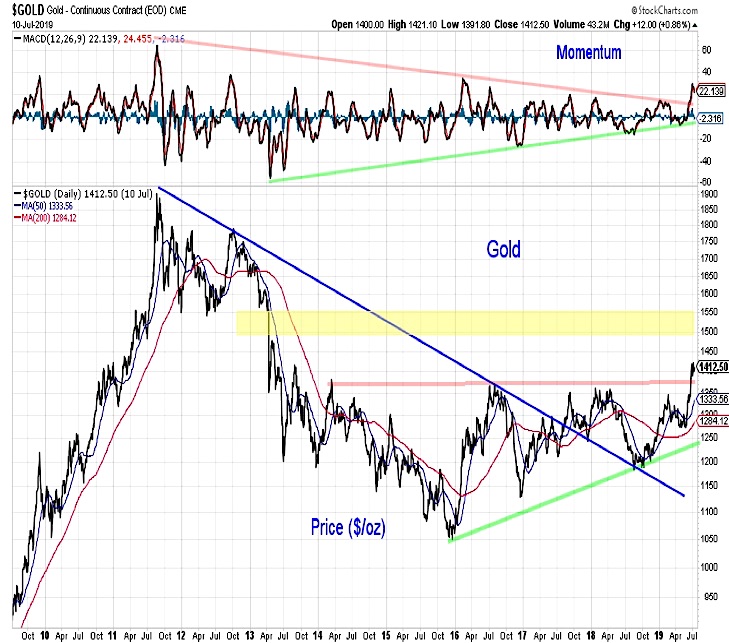
Gold (NYSEARCA: GLD) breaking to the upside following lengthy consolidation.
The S&P 500 (NYSEARCA: SPY) is back to record territory, up nearly 20% for 2019 so far. The Dow Industrials and NASDAQ Composite have also made new highs. The Russell 2000 and Value Line Geometric Index have lagged and remain well below the highs reached last summer.
Sector-level indexes (Broker/Dealers, Transports, and Semiconductors) that tend to confirm moves in the broader indexes remain shy of their peaks as well.
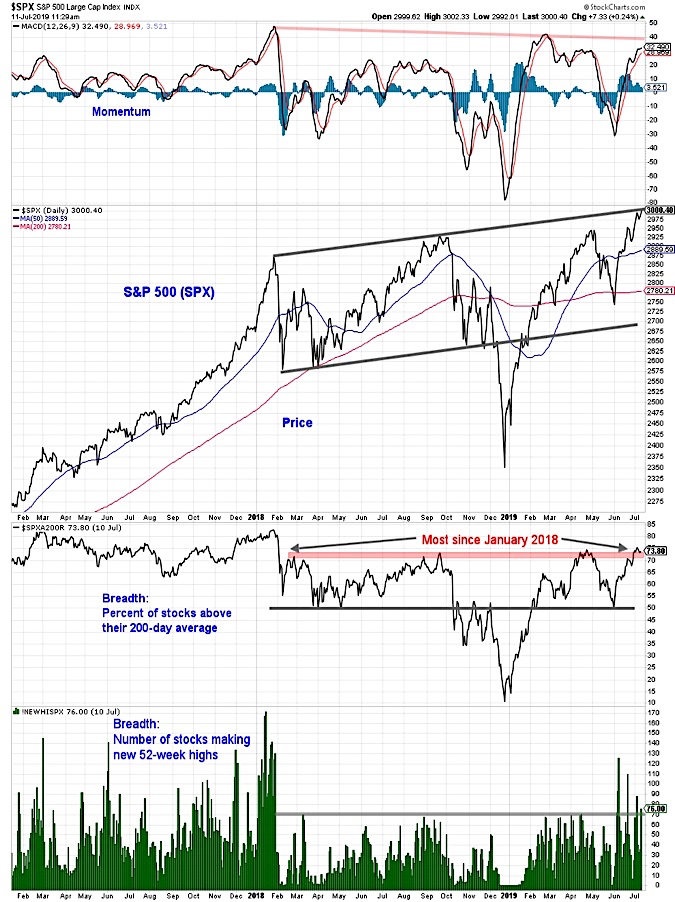
Within the S&P 500 itself, the percentage of stocks trading above their 200-day averages recently climbed above 75%, the highest level since January 2018. The number of stocks making new highs has begun to expand after nearly 18 months of muted readings.
These market breadth improvements have lagged, rather than led, price and are still not consistent with historical signs of strength. Momentum on the S&P 500 is improving, though is still shy of previous peaks. Despite this less-than-ideal backdrop, a case can be made that what had appeared to be a lengthy consolidation for the S&P 500 is morphing into a modestly rising up-trend.
Further improvement in breadth would help confirm this. Textbooks can provide retrospective evidence of all-clear signals, but in real-time the message tends to be a bit sloppier.
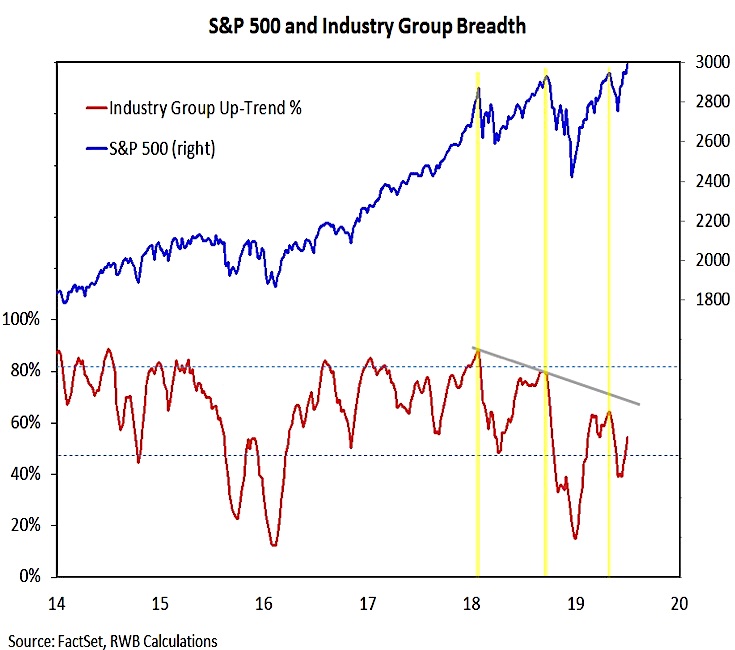
Historically muted rally participation remains an ongoing concern and rallies that garner broad support tend to be more robust. A distinction needs to be made, however, between a lack of confirmation and evidence of divergences. The lower peaks from our industry group trend indicator over the past 18 months represent divergences from the S&P 500 – but these could not be identified until after the indicator rolled over.
In the current case, industry group trends are improving (after having made a higher low) but have not confirmed index-level strength. It is premature, however, to conclude that another divergence (lower high) will emerge. That remains to be seen.
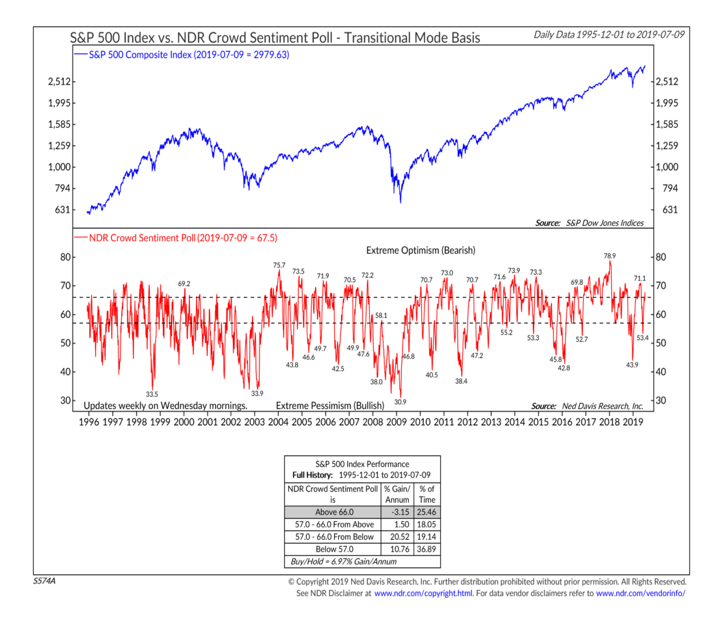
Whether the rally has enough time for breadth to catch up to price may hinge on how investors react. While not universal, there is evidence that sentiment is becoming excessively optimistic and this could shorten the lifespan of the current rally and delay hoped-for breadth gains. The NDR Crowd Sentiment Poll has moved back into the optimism zone, an area in which upside for stocks has been historically limited.
Individual indicators are mixed (which is one reason to lean on sentiment composites). Data this week from ICI showed a recent surge in equity fund outflows. While this may at first seem like a contrarian bullish signal, it may also reflect an absence of institutional commitment needed to drive a sustainable advance in stocks.
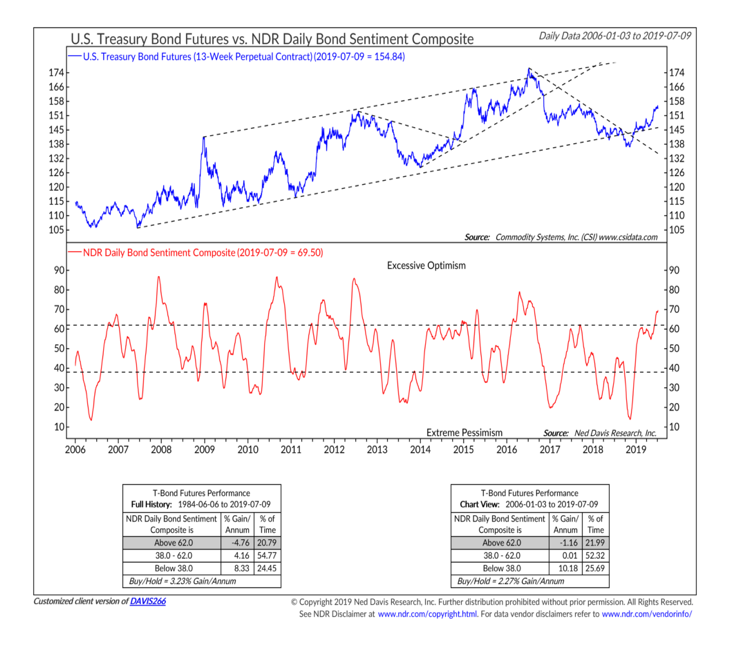
Optimism is not only being seen in stocks – it is showing up in bonds as well. A sentiment composite for bonds is showing the most optimism since mid-2016 (after the yield, which moves opposite to prices, on the 10-year T-Note had dropped from 2.3% to 1.4% over the course of six months).
In the current case, the T-Note yield has fallen from 3.2% to 2.0% since October. After the emergence of excessive optimism in bonds in 2016, the T-Note yield rallied from 1.4% to 2.6% over the course of six months. Whether a bond market replay of 2016 emerges in 2019 remains to be seen, but the very crowded trade in bonds right now is looking for yields to continue to fall.
After a series of shiny, though ultimately false, starts over the past few years, gold has broken above well-tested resistance near 1380. This price move has been accompanied by an upside breakout in momentum. It has also been accompanied by a surge in optimism (yes, elevated/excessive optimism is being seen in stocks, bonds and gold – a reminder that even with improving trends, risks are still elevated).
Optimism could frustrate near-term rally attempts in gold, but with the trend and momentum backdrop improving, gold could ultimately be poised to challenge resistance in the 1500-1550 zone. Support is near the breakout level of 1380.
Twitter: @WillieDelwiche
Any opinions expressed herein are solely those of the author, and do not in any way represent the views or opinions of any other person or entity.

 Rolling Over At Key Fibonacci Level?")


