Economic Data Adds To Federal Reserve’s Dilemma
The equity markets scored early September gains last week with the S&P 500 (INDEXSP:.INX) and Dow Jones Industrials (INDEXDJX:.DJI) gaining 0.5%, which made up for the 0.2% loss in the month of August. Stocks were supported by economic data that conflicted with indications that the Federal Reserve would soon raise interest rates.
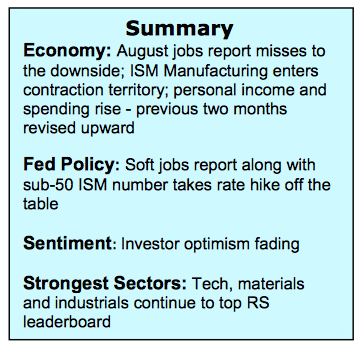
The ISM Manufacturing Index fell by the most since January 2014–falling below 50, a level economists consider evidence that the industrial base has entered into a contraction phase. Any consideration that Fed Chief Janet Yellen will raise the fed funds level 25 basis points in September was further undermined by the Labor Department Report that job growth slowed in August.
Although a Federal Reserve interest rate hike is not completely out of the picture, a move by the Fed appears remote with the CME Fed futures market indicating only a 21% chance. The odds improve for December with the handicap rising to 51%. This highlights the Federal Reserve’s dilemma.
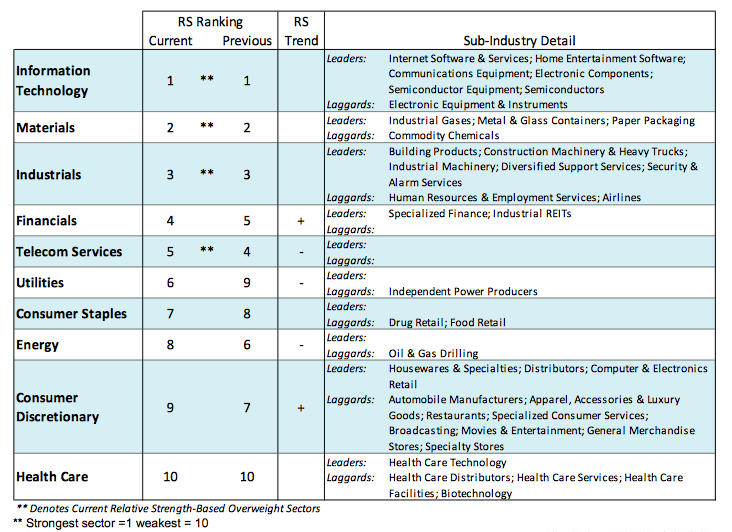
After Labor Day, the focus of attention will move to the November 8 presidential election. Historically, if the election is anticipated to be close, the financial markets trade defensively in the two months leading up to the event. The strongest sectors continue to be those that are most sensitive to the business cycle including the materials, industrial and information technology.
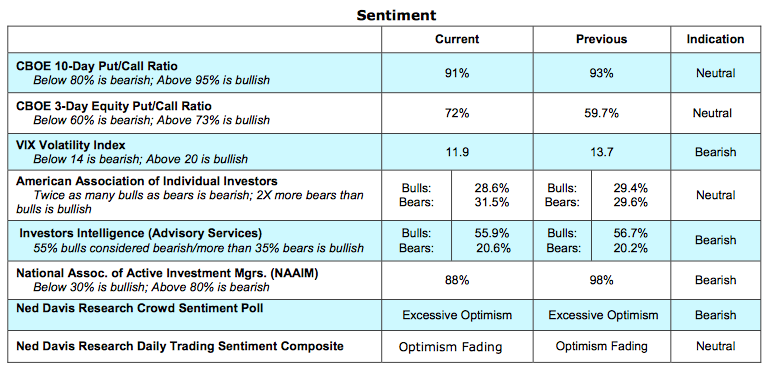
The technical condition of the stock market is mixed with long-term breadth trends bullish, momentum neutral and sentiment bearish. The percentage of industry groups within the S&P 500 that are in uptrends is a healthy 78%. This is in sharp contrast with August and September of 2015 when less than 30% were positive. Volume on the major exchanges in August plunged halting the momentum surge that followed the UK vote in June. Despite the loss of upside velocity, the trend of the market remains bullish with most of the indices at or near record highs. Investor sentiment indicators continue to show excessive optimism. In addition, consumer confidence improved in August to its highest level in nearly a year. Our concern centers on the data from Investors Intelligence (II), which tracks the opinions of Wall Street letter writers. The bullish contingency slipped to 55.9% last week from 56.7% but remains above the 55% level where stocks have historically experienced resistance. The most recent data from the National Association of Active Investment Mangers (NAAIM) shows a relatively high allocation to stocks, 88% last week. Overall, the technical indicators point to a trading range environment as we move deeper into the third quarter with the risk to 2110 and the reward to 2210 using the S&P 500.
Thanks for reading.
Twitter: @WillieDelwiche
Any opinions expressed herein are solely those of the author, and do not in any way represent the views or opinions of any other person or entity.


