Last week was the reset of the January 6-month calendar range.
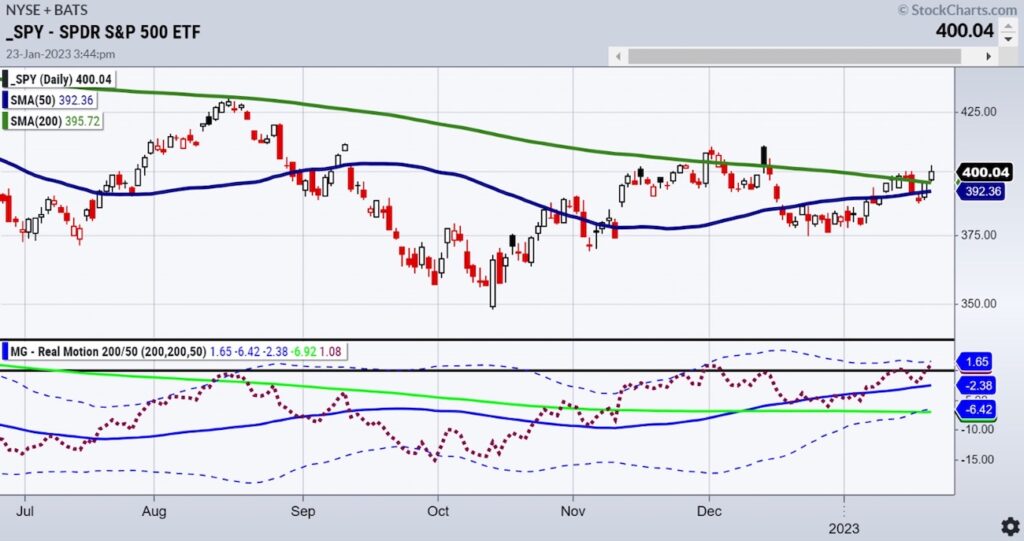
For the S&P 500, that range sits at 3770-4000.23.
In the 2023 Outlook, the prediction for the yearly range is much wider or between 3200-4200. That is based on the position of two key monthly moving averages.
Looking at the 6-month range, today’s high was 402.64, but SPY closed at 400.52 Just marginally above the range and well below the high of the day.
Also, interesting to note is the 50-week moving average, which SPY has yet to clear.
So positive action. Yes!
The signal to go full blown long? Not so fast.
What is momentum telling us?
Before we look at momentum, a couple of other interesting areas of potential importance right now, ahead of lots of earnings, the PCE number and a Federal Reserve blackout period.
First off there are the junk bonds and the 2 ETFs we watch HYG and JNK.
Both are crucial to the market breadth and both closed red and are underperforming SPY. That makes the exuberance right now suspect.
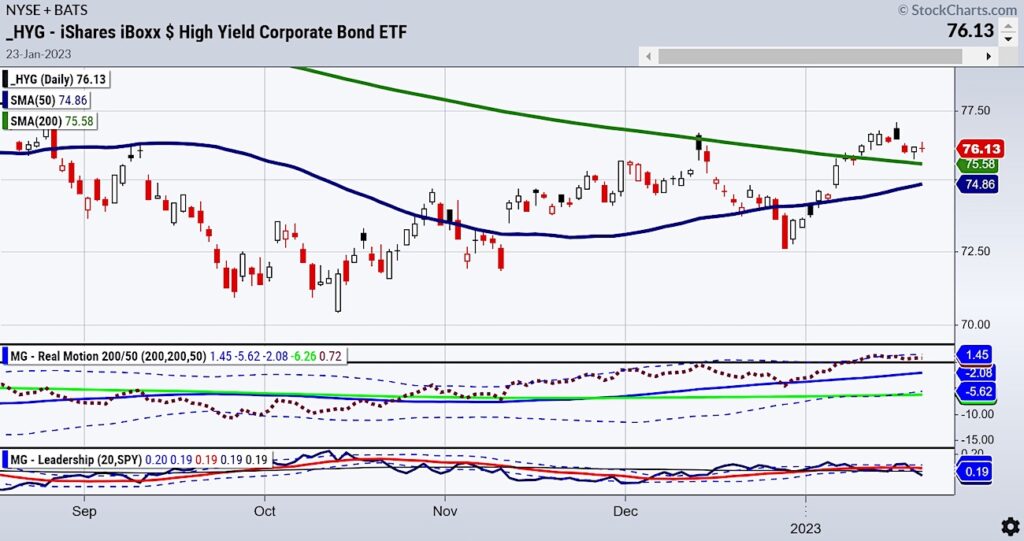
Note the bottom of the chart. The blue line sits well under the red line-that means underperformance.
Our Real Motion Indicator helps to assess growing, slowing, or changing momentum in any and every tradeable financial instrument.
As noted by the chart, in high yield grade bonds, momentum trades sideways after a sell signal (mean reversion) last week.
Circling back to the SPY, momentum reflects the resistance auspiciously right near the calendar range.
Just under the dotted line (Bollinger Band) we need more momentum to be convinced this rally can continue.
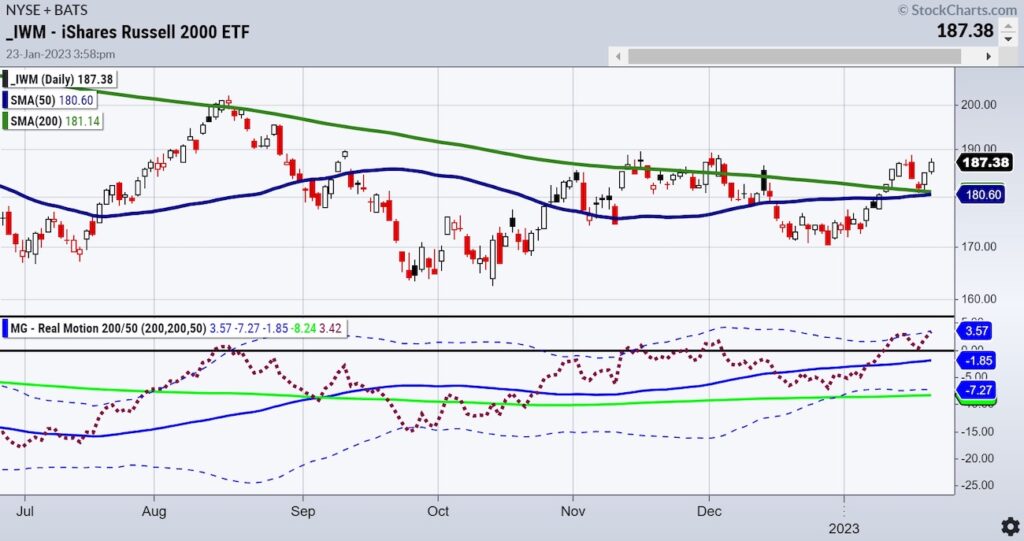
One market that we are keeping a close eye on is small caps.
The Russell 2000 is the leader of the Economic Modern Family.
The 6-month January range high is 187.84. IWM closed below that level.
Momentum tells us that after last week’s mean reversion, Monday’s retest of the Bollinger Band is worth paying attention to.
Putting it all together:
SPY rallies to resistance, shows “meh” momentum but marginally clears the calendar range high-neutral to bullish
HYG underperforms the SPY and rallies into momentum resistance-neutral to slightly bearish (also trading well under its 6-month calendar range high).
IWM closes under the calendar range high and momentum tests resistance-neutral to slightly bullish.
Bottom line: Bulls need to see more-more momentum, higher prices, and high yield bonds happy.
Bears need to see more-SPY and IWM falling from here, momentum declining, and high yields bonds continuing south.
Yep, it’s that close.
STOCK MARKET ETFs Trading Analysis & Summary:
S&P 500 (SPY) SPY has crossed the 200-DMA and is now slightly above it, but is still a very narrow price range below to 50-DMA. Held pivotal support and now what was resistance is support at the 200-DMA and resistance is 405 overhead.
Russell 2000 (IWM) Filled the gap and continued to hold the 200-DMA and overhead resistance at 189.
Dow (DIA) Back under the 50-DMA STILL as industrials lose ground to tech, but holding support at 335 and looking to cross the 50-DMA at 336.07
Nasdaq (QQQ) Crossed the 50-DMA on Friday to close above. First level of resistance is at the 200-DMA and closing slightly below it.
Regional banks (KRE) Close to crossing 60.72 (50-DMA). First level of support is 58 and resistance is 50-DMA.
Semiconductors (SMH) Still holding key support easily at the 50-WMA and 200-WMA. 221 support and 228 resistance.
Transportation (IYT) Still holding 225 key support here and now holding first level of support holding 227.
Biotechnology (IBB) Still best sector with 132 key support still holding and holding first level of support at 134 now with 137 resistance.
Retail (XRT) Holding pivotal support at 63. Resistance at 66.
Twitter: @marketminute
The author may have a position in mentioned securities at the time of publication. Any opinions expressed herein are solely those of the author and do not represent the views or opinions of any other person or entity.


