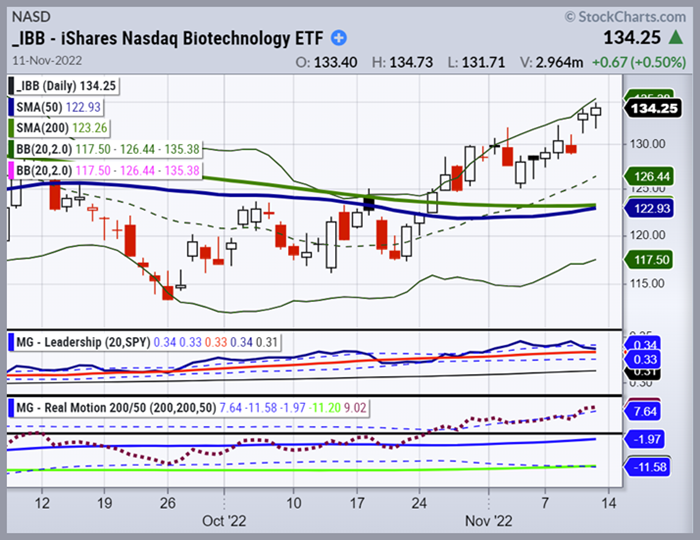
Big Bro Biotech (IBB) is the most highly speculated and volatile sector of Mish’s
Modern Family. IBB is breaking out to new highs displaying Leadership.
The mid-terms are now somewhat behind us, and this week we saw FTX crypto exchange file Chapter 11. Some investors worry that there might be more domino effects in the institutional crypto space.
It is worth keeping an eye on.
Concerning the market, the mild CPI inflation numbers caused a rally to erupt. Yields plummeted, the dollar softened, precious metals exploded higher, and investors had an economic reason to support a Fed pivot.
All indices improved their market phases this week, with Grandpa IWM and DIA closing above their 200-day moving averages, and SPY & IWM are back above their 50-day moving averages.
However, the SPY, IWM, and QQQs are all overbought on price and momentum according to MarketGauge’s Real Motion Indicator and may be subject to mean reversion ultimately.
With high inflation and global central banks tightening, where do the indices go from here?
Looking at past seasonality patterns, the fourth quarter has strong mid-term election past bullish seasonal trends.
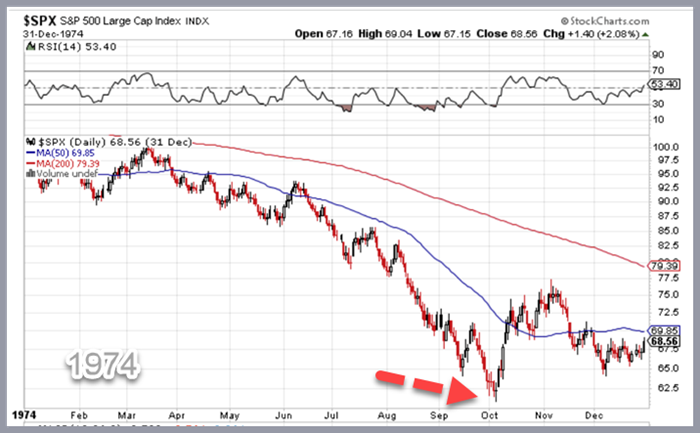
The 1973–1974 stock market crash was one of the worst downturns. It was compounded by the outbreak of the 1973 oil crisis, high unemployment, inflation, and the dollar’s collapse.
The bear market between January 1973 and December 1974 was one of the worst. In 1974, the S&P 500 increased by 20% in October and November before reversing most of the gains in December.
Looking at prior bear market patterns and all three indices helps provide perspective on the overall market’s direction.
SPY still has work to do before breaking out of its current trading pattern. The DIA and IWM have the most potential for growth in the short term.
It’s fundamental to understand where each index is trading relative to one another. The next several weeks should reveal which way these indexes are trending and whether they are trending in the same direction.
The perception of lower inflation also spurred the gold market to new highs and improved its market phase. Gold closed over its 200-day moving average and transitioned from bearish to an accumulation phase – which has paid off handsomely for subscribers.
The sector leading the market up is Biotech (Sister Semiconductor) which is breaking out of a massive head and shoulders pattern on the daily chart, which we covered in live training yesterday.
We also suggest paying attention to the indices’ November 3 lows and any measured moves into resistance, such as critical levels like 420 in the SPY.
Risk management (Mish’s specialty) is especially key in these volatile markets, and if you are net yet a subscriber to Mish’s Market Minute Advantage service, now’s the time!
Stock Market ETFs Trading Analysis & Summary:
S&P 500 (SPY) 394 support and 402 resistance
Russell 2000 (IWM) 183 support and 190 resistance
Dow (DIA) 333 support and 341 resistance
Nasdaq (QQQ) 283 support and 291 resistance
KRE (Regional Banks) 63 support and 68 resistance
SMH (Semiconductors) 215 support and 224 resistance
IYT (Transportation) 225 support and 233 resistance
IBB (Biotechnology) 132 support and 136 resistance
XRT (Retail) 63 support and 67 resistance
Twitter: @marketminute
The author may have a position in mentioned securities at the time of publication. Any opinions expressed herein are solely those of the author and do not represent the views or opinions of any other person or entity.

: Showing Some Signs of Emerging Strength")
