THE BIG PICTURE
With week 12 in the books, the major stock market indices continue to a pullback withing a broader move to the upside – an ongoing uptrend holding above each indices respective 50/144 ema and key moving averages (50, 200) on higher time frames. Note that you can find last week’s recap here.
The 10 day moving average has lost support on both the Dow Jones Futures (YM) and S&P 500 Futures (ES); a first indicator of a near-term trend break. This adds caution near-term for the S&P 500 (INDEXSP:.INX).
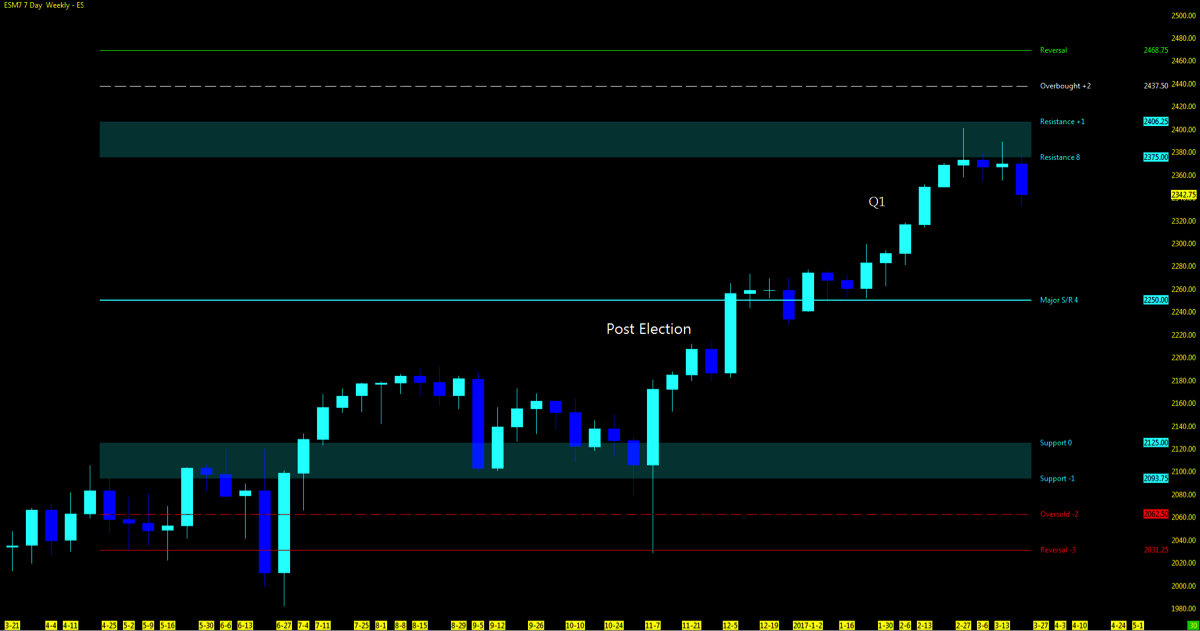
The ES which has found significant resistance on a weekly MML chart has a 50% probability of a pullback to major support/resistance at 2250 if the 50 day moving average is unable to hold. This would put the ES in proximity of its’ 200 day moving average, not seen since November of 2016. Here’s a longer term trend chart.
The VIX Volatility Index (INDEXCBOE:VIX) levels continue to remain low in the high 12’s (a concern). With the health care legislation out of the way for now and not for the better, the three biggies which seem to loom over the market from an economic reform standpoint include taxes, infrastructure and trade. This is where the market thought it would see change, and unless something significant comes out of these headliners, price action may struggle at these highs.
Key events on the horizon include Federal reserve speakers, GDP and Brexit (so watch for volatility). Don’t rule out Washington politics and worldly imbalance to set the market in motion.
The Bottom Line
Watch price action around the daily 50ma on market indices. If unable to hold, price action may seek support around 50% pullback and open gaps. Upside action look for price to regain the 10dma and push above.
Technical momentum probability REMAINS in an UPTREND on the bigger picture. Signs of market weakness started to show in week 11 and followed through in week 12. Observe the intraday on the 60/15m charts for any alert of the change in trend or continued movement upside. I will continue notify through social media and my daily outlook; posted 15 minutes prior to the US open of any updates throughout the week.
For the Indices ETF or long term holder, different rules may apply as quarterly re-balancing which is approaching and is my preference for managing such markets. Option to move trailing stops to key MML, Fibonacci or moving average levels can lock in more profit if and when a pullback may occur.
Note that you can also view my market outlook on YouTube. Markets Covered: ES, YM, NQ, GC, CL
Attempting to determine which way a market will go on any given day is merely a guess in which some will get it right and some will get it wrong. Being prepared in either direction intraday for the strongest probable trend is by plotting your longer term charts and utilizing an indicator of choice on the lower time frame to identify the setup and remaining in the trade that much longer. Any chart posted here is merely a snapshot of current technical momentum and not indicative of where price may lead forward.
NQ – Nasdaq Futures
Technical Momentum: UPTREND Pullback
Note that using the Murray Math Level (MML) charts on higher time frames can be a useful market internal tool as price action moves amongst fractal levels from hourly to daily charts. Confluence of levels may be levels of support/resistance or opportunities for a breakout move. CHARTS: Daily; Range; 4hr
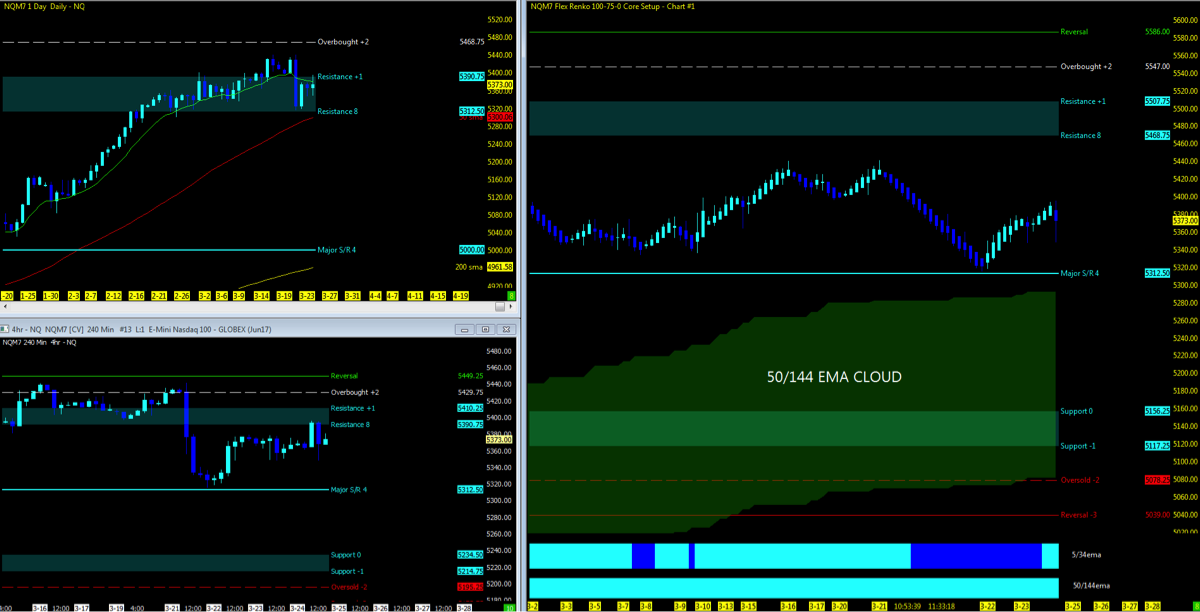
Nearest Open Daily Gap: 5232.5
Lowest Open Gap: 4017
ES – S&P Futures
Technical Momentum: UPTREND Pullback
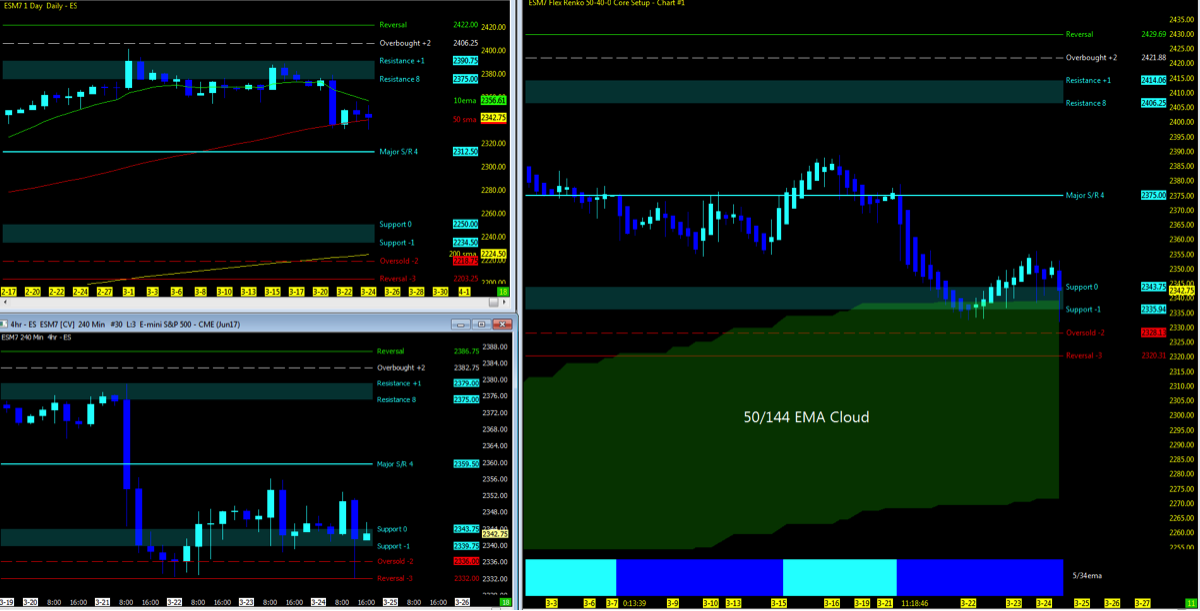
Nearest Open Daily Gap: 2315.75
Lowest Open Gap: 1860.75
YM – DOW Futures
Technical Momentum: UPTREND Pullback
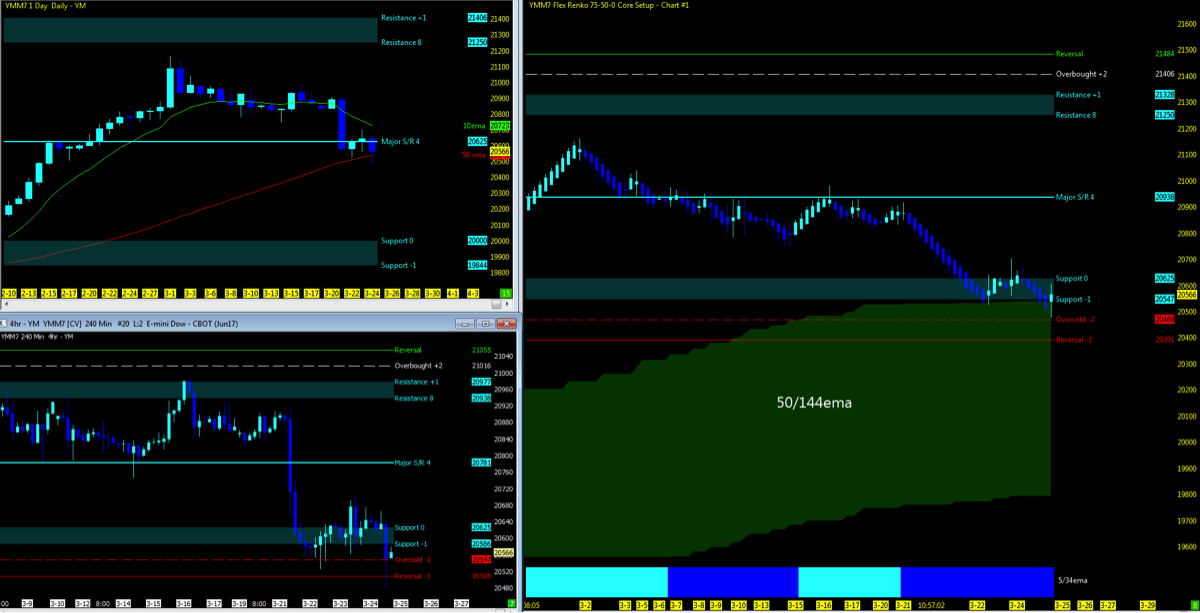
Nearest Open Daily Gap: 20248
Lowest Open Gap: 15924
Thanks for reading and remember to always use a stop at/around key technical trend levels.
Twitter: @TradingFibz
The author trades futures intraday and may have a position in the mentioned securities at the time of publication. Any opinions expressed herein are solely those of the author, and do not in any way represent the views or opinions of any other person or entity.


