THE BIG PICTURE
Q1 – what a ride!
Looking at the weekly chart of the S&P 500 futures (below), it has been nothing but relentless price momentum upside with the casual minor pullback on a S&P 500 (INDEXSP:.INX) daily chart.
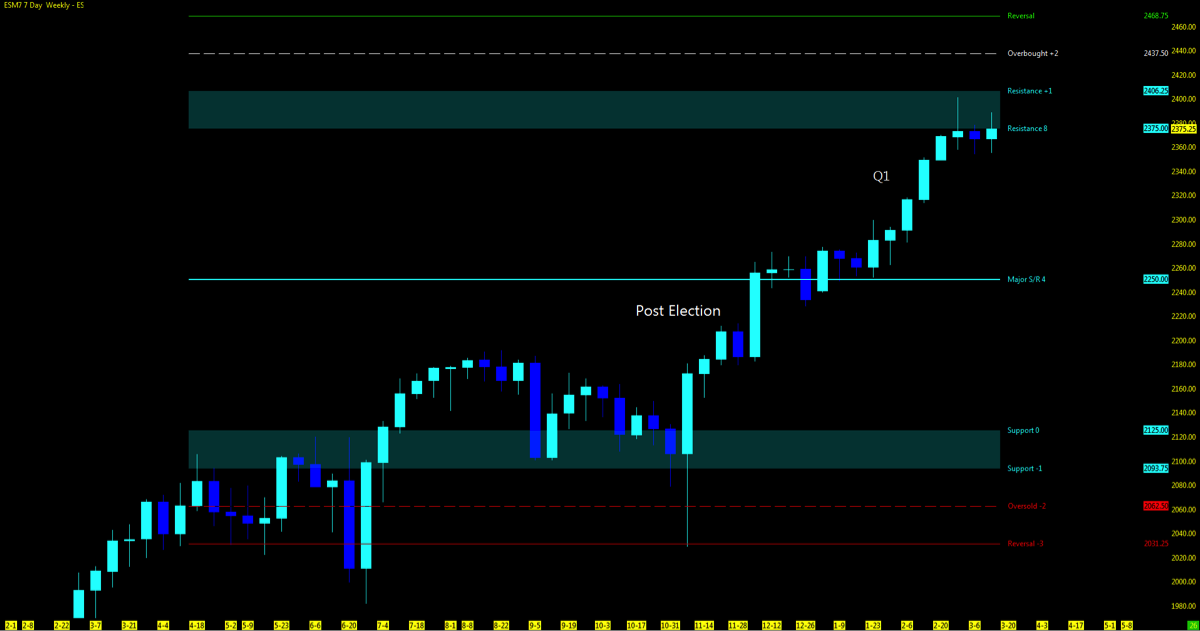
Permabears have been littering the twitter waves for months now waving their “bubble” flags in hopes that the day will be sooner rather than later that they told you so. The count is endless in the number of technical signals that have been broadcasted that have simply been run over and right through as we have pushed the limits of the market. Overvaluations, overbought and the next big short; all common terms and themes to make headlines (in hopes that they were the ones that called it first).
Meanwhile, my IJR and TQQQ holdings continue to reap the benefits of this momentum move based on Jason Kelly’s quarter re-balancing. Had I listened to any of the naysayers starting back in 2014, I would have missed on the gains I have attributed during the market’s rally, illogical as it may be to many of you. I keep it simple Jedi traders. The hopes of a deeper pullback would have been well timed to close out open gaps that I have mentioned in my previous weekly outlooks. But we have yet to see that.
Either way, one fact is for sure and will be rehashed for years to come, the rally that went against all the rules is in the books.
#NowWhat?
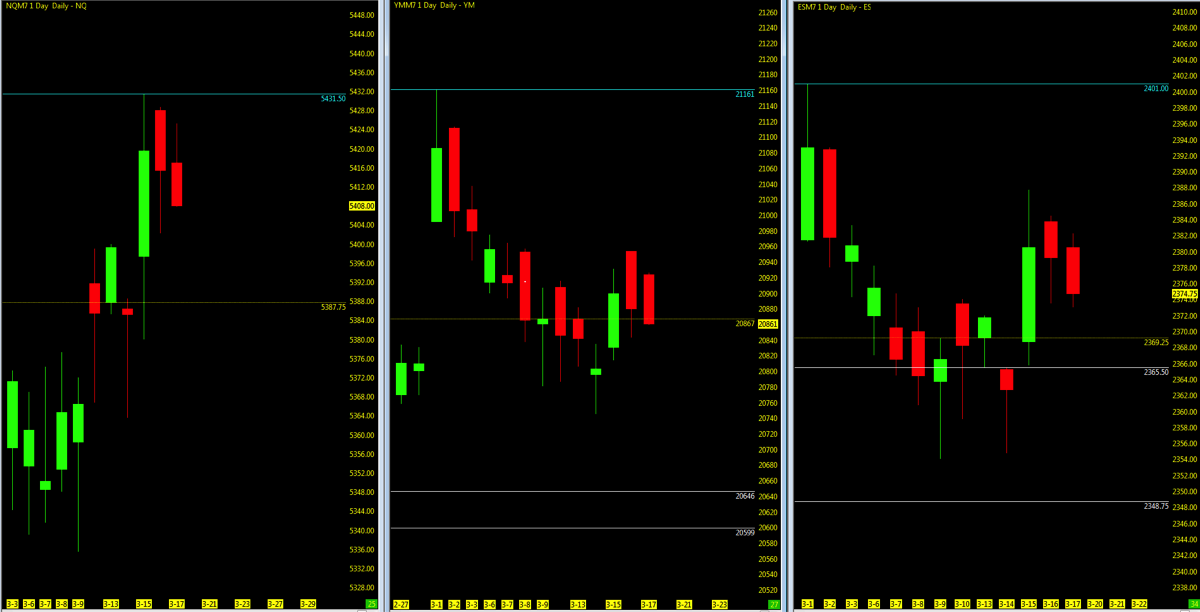
Looking ahead to week 12, you can see that the Nasdaq (INDEXNASDAQ:.IXIC) has made new highs while the S&P and Dow haven’t. VIX levels continue to remain low as technical indicators by my charts have just enough reason to go in either direction. I know that is not what you want to hear, but consolidation is exactly that. Key events in the market this week include Federal reserve speakers and a steady diet of Washington politics and news… this seems to be playing a bigger role in 2017.
Watch those daily/weekly and monthly VWAP for support and resistance both intraday and the higher time frames.
Bottom Line: Watch for any pullbacks to the open gaps on the YM or ES. If the daily lows continue to be bought and lifted, TREND will remain upside and may retest the perspective all time highs.
Note that you can also view my market outlook on YouTube.
Attempting to determine which way a market will go on any given day is merely a guess in which some will get it right and some will get it wrong. Being prepared in either direction intraday for the strongest probable trend is by plotting your longer term charts and utilizing an indicator of choice on the lower time frame to identify the setup and remaining in the trade that much longer. Any chart posted here is merely a snapshot of current technical momentum and not indicative of where price may lead forward.
NQ – Nasdaq Futures
Technical Momentum: UPTREND
Using the Murray Math Level (MML) charts on higher time frames can be a useful market internal tool as price action moves amongst fractal levels from hourly to daily charts. Confluence of levels may be levels of support/resistance or opportunities for a breakout move.
- CHARTS: Daily; Range; 4hr
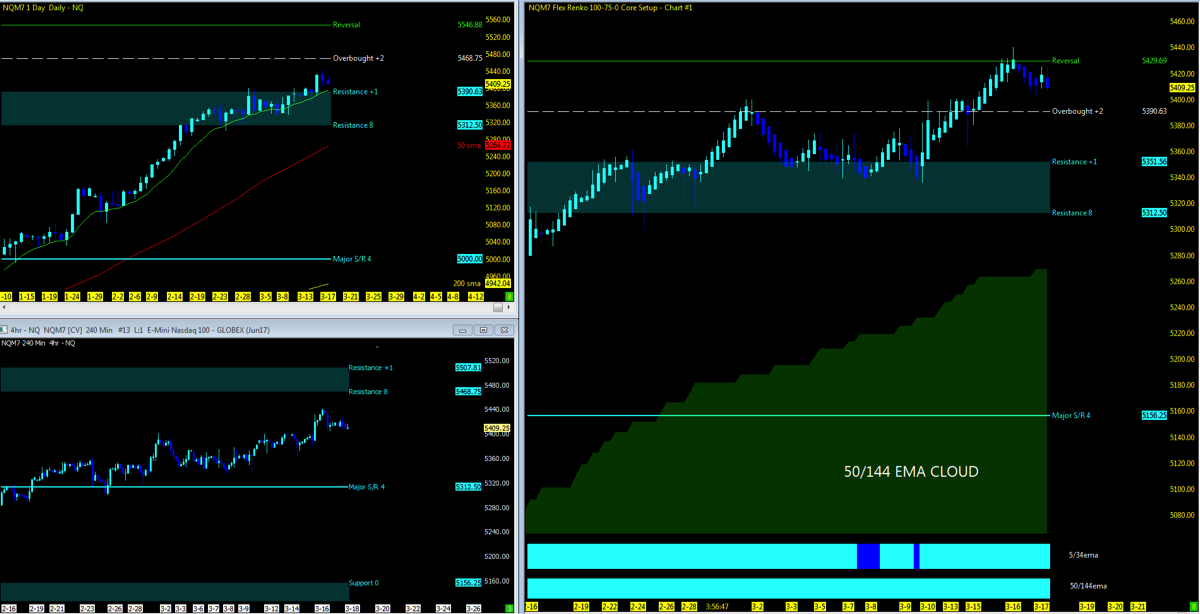
Nearest Open Daily Gap: 5232.5
Lowest Open Gap: 4017
ES – S&P Futures
Technical Momentum: UPTREND
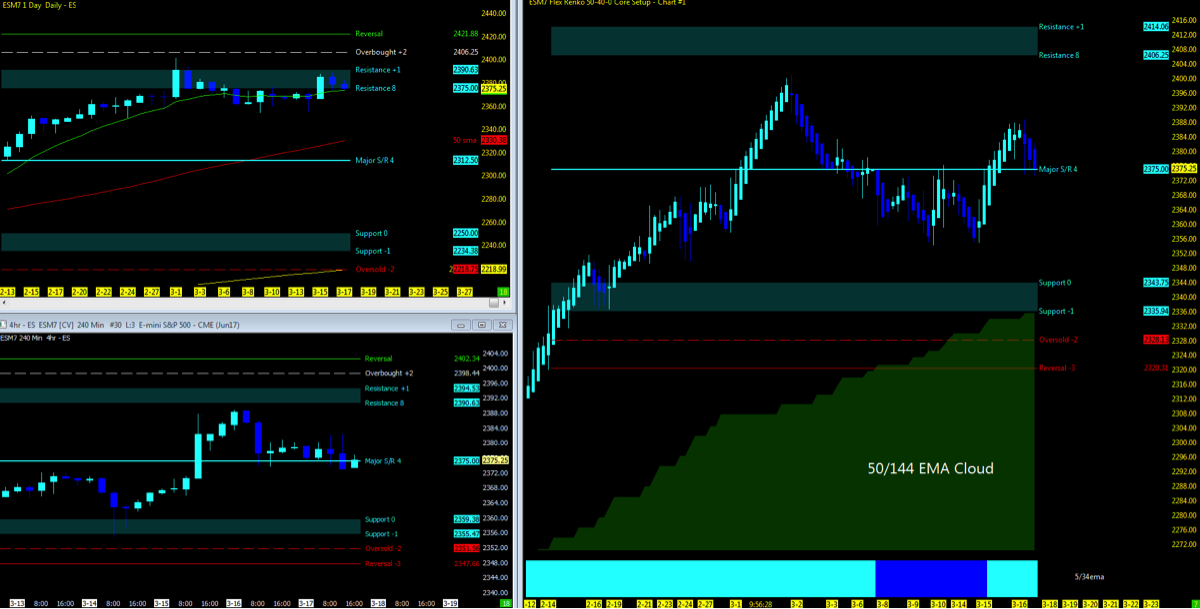
Nearest Open Daily Gap: 22365.50//2348.75
Lowest Open Gap: 1860.75
Thanks for reading and remember to always use a stop at/around key technical trend levels.
Twitter: @TradingFibz
The author trades futures intraday and may have a position in the mentioned securities at the time of publication. Any opinions expressed herein are solely those of the author, and do not in any way represent the views or opinions of any other person or entity.


