THE BIG PICTURE – Stock Market Futures
2017 rolled in with a dud as the stock market indices ended the year on a low note. And although early trading started off strong, it took a couple days to get a read on the trend.
The jobs report was the latest catalyst to push stocks higher… high enough for the DOW to miss 20k by 0.37 ticks but good enough for the NQ futures to ring the 5K bell. So, now what?
As with any time in the past when the stock market indices continue to push to new highs, there will be two opinions on the market. Those that side with “when at the highs, we go higher” and those that persistently are pessimistic and think the market should just crash. But it’s best to have a process and follow it.
In the week to come I expect the Dow Jones futures to ring the 20K bell. But beware of some volatility – volume has returned to the market and multiple fed speakers are on tap this week. Watch for Yellen’s speech on Thursday night.
Although probability points to higher prices in the days ahead, any news catalyst can also throw this market in the opposite direction. On a move lower, we need to watch the daily 50ma or major support on the MML (Murray Math) charts. Always be ready for both directions intraday.
As always, leave your bias at the door of where you think the market should be. Watch the charts in front of you and stay away from the Z-Vals. Be ready in both directions. The trend reveals itself on Heikin Ashi bars and proper trade management keeps you in the trend.
Attempting to determine which way a market will go on any given day is merely a guess in which some will get it right and some will get it wrong. Being prepared in either direction intraday for the strongest probable trend is by plotting your longer term charts and utilizing an indicator of choice on the lower time frame to identify the setup and remaining in the trade that much longer. Any chart posted here is merely a snapshot of current technical momentum and not indicative of where price may lead forward.
Note that you can also view my market outlook for ES, YM, and NQ on YouTube.
Nasdaq Futures – NQ
Hourly Chart: UPTREND
Using the Murray Math Level (MML) charts on higher time frames can be a useful market internal tool as price action moves amongst fractal levels from hourly to daily charts. Confluence of levels may be levels of support/resistance or opportunities for a breakout move.
Daily Range Chart
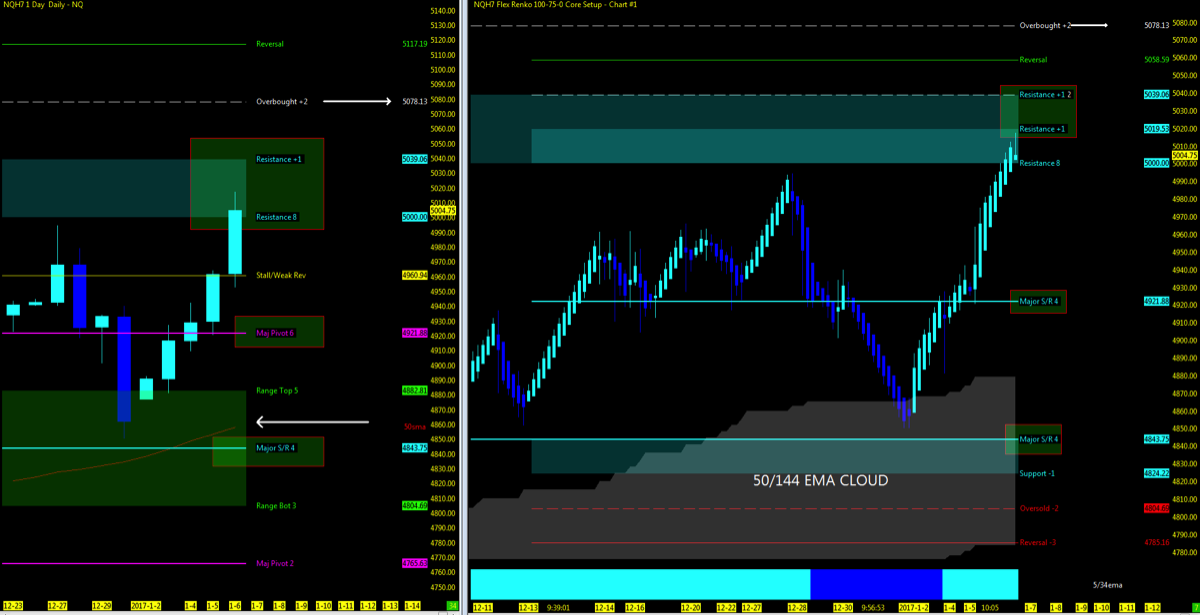
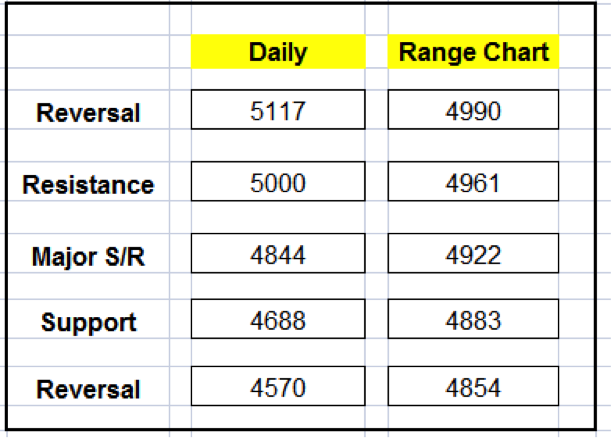
Levels to Watch
- Upside: 5078 if we break 5039
- Downside: 4922 (50ma below)
- Major S/R: 4843 (50ma in zone) if we break 4882
MML Levels (NQ)
Nearest Open Daily Gap: 4610.75
Lowest Open Gap: 4017
S&P Futures – ES
Hourly Chart: UPTREND
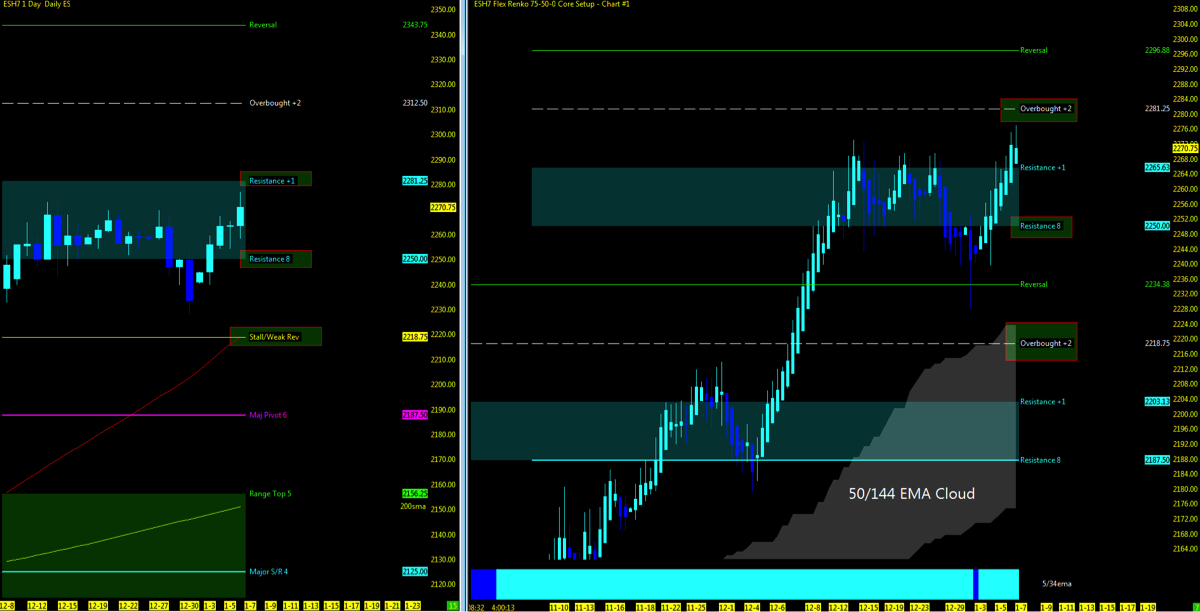
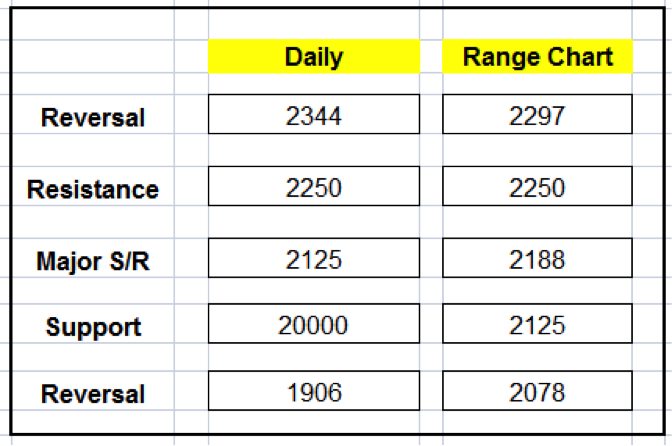
Levels to Watch
- Upside: 2312 (watch 2218.25 resisatance)
- Downside: 2218.75 (50ma in zone) if we break 2250
- Major S/R: 2125 (200ma above)
MML Levels (ES)
Nearest Open Daily Gap: 2197.25
Lowest Open Gap: 1860.75
Thanks for reading and remember to always use a stop at/around key technical trend levels.
Twitter: @TradingFibz
The author trades futures intraday and may have a position in the mentioned securities at the time of publication. Any opinions expressed herein are solely those of the author, and do not in any way represent the views or opinions of any other person or entity.


