THE BIG PICTURE – Stock Market Futures
2016 is out the door. Welcome to 2017!
You may have never thought we would make it through the presidential election in one piece and the uncertainty from one fed meeting to another didn’t make anything feel very smooth. However, markets eventually consolidated gains and losses and are doing so with the post-election run up right now.
Heading into 2017, we are faced with similar uncertainty. Questions around how many fed rate hikes will we see, how will Brexit play out, Trumpenomics and the unsettling world civility seem to be at the forefront of our attention.
That said, as traders we simply take one day and one week at a time. Currently, it seems reasonable to expect a pullback to downside open gaps. Will that occur before or after Dow 20k? Volume should return as traders emerge from their holiday caves and once again bring some daily momentum to the charts.
My best memory of 2016? The Cubs winning the World Series.
As always, leave your bias at the door of where you think the market should be. Watch the charts in front of you and stay away from the Z-Vals. Be ready in both directions. The trend reveals itself on Heikin Ashi bars and proper trade management keeps you in the trend.
Attempting to determine which way a market will go on any given day is merely a guess in which some will get it right and some will get it wrong. Being prepared in either direction intraday for the strongest probable trend is by plotting your longer term charts and utilizing an indicator of choice on the lower time frame to identify the setup and remaining in the trade that much longer. Any chart posted here is merely a snapshot of current technical momentum and not indicative of where price may lead forward.
Note that you can also view my market outlook for ES, YM, and NQ on YouTube.
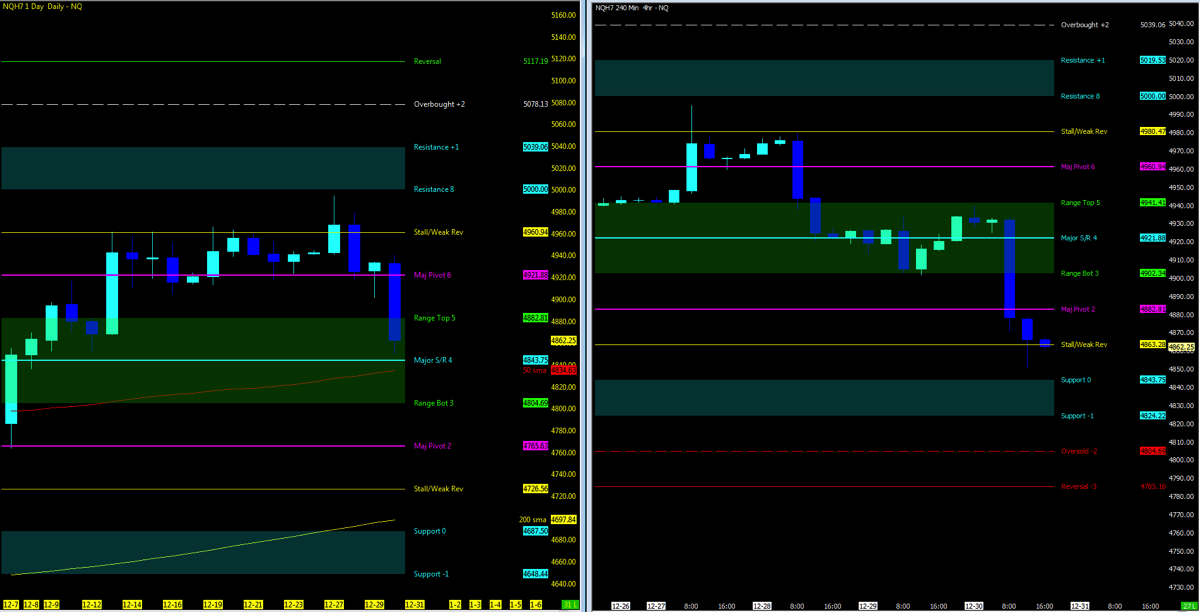
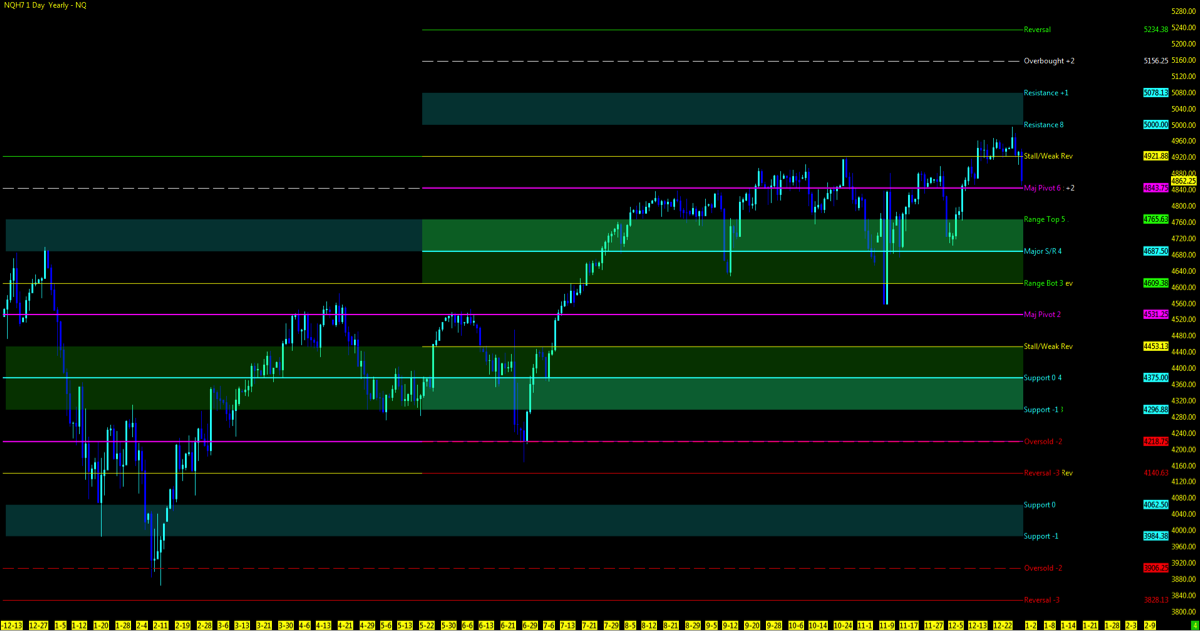
Nasdaq Futures – NQ
Using the Murray Math Level (MML) charts on higher time frames can be a useful market internal tool as price action moves amongst fractal levels from hourly to daily charts. Confluence of levels may be levels of support/resistance or opportunities for a breakout move.
Yearly Picture
MML Levels (NQ)
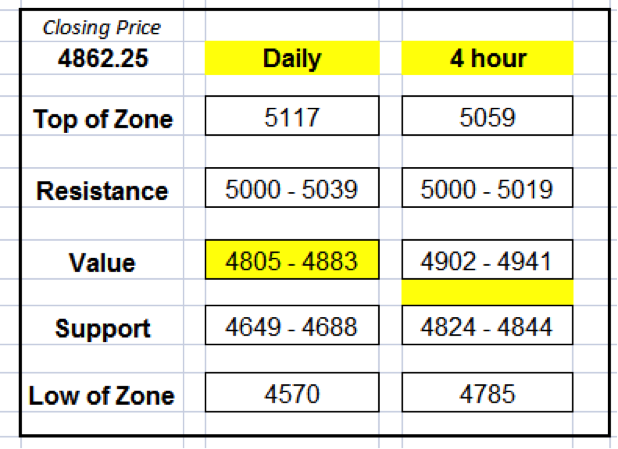
Nearest Open Daily Gap: 4610.75
Lowest Open Gap: 4017
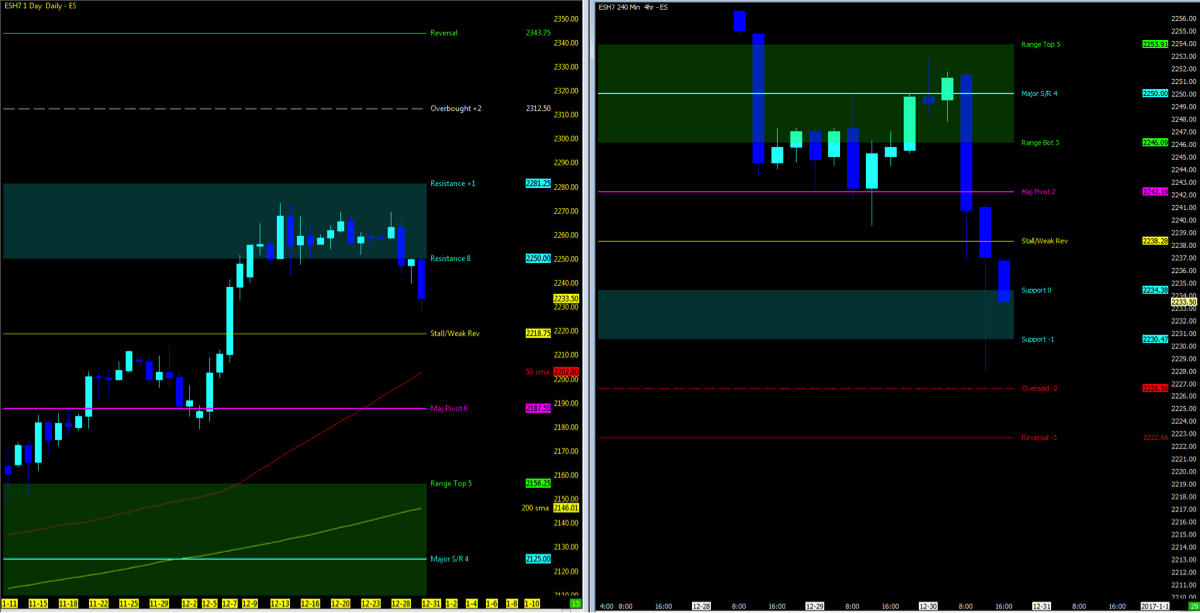
S&P Futures – ES
continue reading on the next page…

: Showing Some Signs of Emerging Strength")
